
Build an LLM From Scratch · Part 5 of 15
Build an LLM From Scratch: The Training Loop
train.py for the series' model: AdamW, warm-up and cosine decay, clipping, BF16, gradient accumulation, exact resume, and a first real loss curve.
On this page
TL;DR
This part writes train.py, the script every later part trains with: AdamW with weight decay on matrices only, linear warm-up and cosine decay to 10% of the peak, clipping at a global gradient norm of 1.0, BF16 autocast over FP32 weights, 32-way gradient accumulation, periodic validation loss, one JSON log line per step, and checkpoints that resume bit for bit. Its first real run trains the 22M model on 230.7 million tokens in 40 minutes, at 99,500 tokens per second, from a validation loss of 10.48 to 4.97. Short ablations show what each piece is for: without warm-up or without clipping the loss ends about 0.3 higher, a rate 8 times too high pushes the loss above where it started, and at equal tokens and equal time a batch 8 times smaller ends 1.57 lower. Part 7’s 88M run will use a peak rate of 6 × 10⁻⁴, 150 warm-up steps and the same 524,288-token batch.
Why it matters
In FP16, 77% of this model’s activation gradients would round to zero. A 25-minute learning-rate sweep can come back with five numbers that say nothing. And two training runs with the same code, data and seed ended 0.23 apart.
None of these raise an error. Part 4 showed the model can memorize one batch; learning from 230 million tokens adds a dozen settings that can each fail silently, and a checkpoint that decides whether a crash 12 hours into Part 7 costs 12 hours.
This part builds the loop piece by piece, then removes pieces to see what breaks. Math Part 9 derived AdamW, warm-up, cosine decay and clipping, and Math Part 10 why pre-norm models train stably; this is the code, and what it measures.
The intuition
Think of a hiker coming down a mountain in fog, trying to reach the valley floor. The learning rate is the length of each stride. At the start the hiker knows nothing about the slope, so the first strides are short (warm-up). Near the bottom, long strides overshoot the lowest point, so they shorten again (decay). If a stride lands on loose rock and the ground suddenly seems to drop away, the hiker caps how far one stride can go (clipping). And before every stride, the hiker asks 32 scouts which way is down and averages their answers (gradient accumulation), because any single scout sees only a few metres of fog.
The analogy breaks in two places. A real mountain stays put, while the loss surface the hiker feels changes with every batch of text. And AdamW doesn’t take one stride: it picks a separate stride length for each of 22 million directions, which is why its settings interact in ways a hiker’s never would.
Step 1: the loop, and what it writes down
train.py is one file of about 170 lines next to model.py and data.py. A run is one command, and the same command plus --resume continues it after a crash:
python train.py --model small --out runs/main --steps 440 --warmup 20 --lr 1.5e-3 \
    --val-every 20 --ckpt-every 40 --keep-ckpts --compile --fused
Every setting is a flag with a default (micro-batch 16, 32 micro-batches per step, betas 0.9 and 0.95, weight decay 0.1, clipping at 1.0, seed 1337). --compile and --fused switch on torch.compile and PyTorch’s fused AdamW kernel; they’re flags because Part 6 measures what each buys.
Each optimizer step runs this code:
# train.py (excerpt): one optimizer step
lr = lr_at(step, a)
for group in opt.param_groups:
    group["lr"] = lr
loss_sum = torch.zeros((), device="cuda")
for _ in range(a.accum):
    x, y = (t.pin_memory().cuda(non_blocking=True) for t in next(batches))
    with autocast:
        loss = model(x, y) / a.accum                  # so the summed gradients are a mean
    loss.backward()
    loss_sum += loss.detach()
max_norm = a.grad_clip if a.grad_clip > 0 else float("inf")
grad_norm = torch.nn.utils.clip_grad_norm_(raw.parameters(), max_norm)   # returns the norm before clipping
opt.step()
opt.zero_grad(set_to_none=True)
loss_val = loss_sum.item()                            # waits for the GPU, so the timing is real
Each step then appends one line of JSON (JavaScript Object Notation) to log.jsonl. JSONL, one JSON object per line, survives a crash mid-write and loads with one line of Python. Step 300 of the run below:
{"step": 300, "loss": 5.134079456329346, "lr": 0.0004875000000000002, "grad_norm": 0.38014811277389526, "tokens": 157810688, "dt": 5.3871, "tok_per_s": 97323, "elapsed": 1628.43}Validation records go in the same file, and the first line records every argument, the model config, the PyTorch version and the GPU, so a log is enough to reproduce its run. The .item() call makes Python wait for the GPU’s queued work, so dt is the step’s real time.
Step 2: AdamW, and which weights decay
Math Part 9 derives AdamW: Adam’s per-weight step sizes, plus weight decay applied to the weights directly instead of through the gradient. The training script only has to decide which tensors get the decay.
def make_optimizer(model, a):
    """AdamW with two groups: matrices (every linear layer and the tied embedding) decay; norm gains don't."""
    decay = [p for p in model.parameters() if p.dim() >= 2]
    no_decay = [p for p in model.parameters() if p.dim() < 2]
    groups = [{"params": decay, "weight_decay": a.weight_decay},
              {"params": no_decay, "weight_decay": 0.0}]
    return torch.optim.AdamW(groups, lr=a.lr, betas=(a.beta1, a.beta2), eps=a.eps,
                             fused=True if a.fused else None)
The rule is nanoGPT’s, whose comment reads “Any parameters that is 2D will be weight decayed, otherwise no. i.e. all weight tensors in matmuls + embeddings decay, all biases and layernorms don’t.” llm.c does the same: “Only (2D) weights are decayed exactly as in GPT-2.” A norm gain is a per-channel scale that starts at 1; pulling it toward 0 would fight the job it does. For our two models:
| Model | Decayed: tensors, parameters | Not decayed: tensors, parameters |
|---|---|---|
| 22M | 43 matrices, 22,020,096 | 13 RMSNorm gains, 4,992 |
| 88M | 71 matrices, 88,080,384 | 21 RMSNorm gains, 16,128 |
The embedding table is the contested case. OLMo 2 turned decay off for embeddings because it “overshoots the mark and results in very small embeddings.” Ours is tied, so it’s also the output layer’s matrix; this series keeps the GPT-2, nanoGPT and llm.c convention and decays it, a one-line change if Part 7’s embedding norms say otherwise. PyTorch multiplies the decay by the current rate, so each step shrinks decayed weights by lr × 0.1, 0.015% at the peak.
Step 3: warm-up, then cosine decay to a floor
Math Part 9 gives the formulas; here is the code, a pure function of the step number, which is what makes resuming exact:
def lr_at(step, a):
    """Linear warm-up to a.lr over a.warmup steps, then cosine decay to a.lr * a.min_lr_ratio at a.steps."""
    if step < a.warmup:
        return a.lr * (step + 1) / a.warmup
    progress = min(1.0, (step - a.warmup) / max(1, a.steps - a.warmup))
    floor = a.lr * a.min_lr_ratio
    return floor + 0.5 * (a.lr - floor) * (1 + math.cos(math.pi * progress))
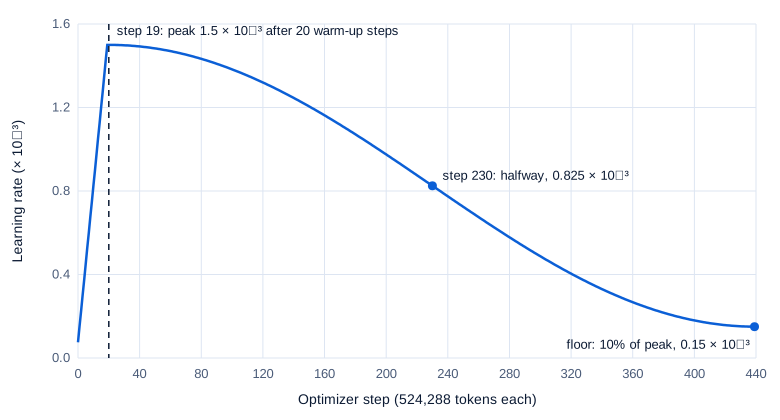
The step + 1 means step 0 trains at 1/20 of the peak rather than at 0, which would waste a step; nanoGPT’s version, learning_rate * (it + 1) / (warmup_iters + 1), makes the same choice. For the 22M run, with a peak of 1.5 × 10⁻³, 20 warm-up steps and 440 steps in all:
| Step | Phase | Learning rate |
|---|---|---|
| 0 | warm-up, 1/20 | 0.075 × 10⁻³ |
| 19 | peak | 1.500 × 10⁻³ |
| 125 | cosine, 25% | 1.302 × 10⁻³ |
| 230 | cosine, 50% | 0.825 × 10⁻³ |
| 335 | cosine, 75% | 0.348 × 10⁻³ |
| 439 | last step | 0.150 × 10⁻³ |
Swipe to pan the diagram, or tap it to zoom.
Two settings come from the Chinchilla paper. The cosine should end where training ends, since “overestimating the number of training steps beyond 25% leads to clear drops in performance,” so --steps is the run’s real length. And the floor is 10% of the peak: decaying 10 times was “slightly more performant” than decaying to 0, and “Decaying by less (5×) is clearly worse.” GPT-3, Llama 2, Pythia and nanoGPT decay to 10%; llm.c’s GPT-2 run decays to 0.
Step 4: clipping, BF16 and accumulation
Clipping by global norm, and logging the norm
clip_grad_norm_ treats all 56 gradient tensors as one long vector and, if its length exceeds 1.0, scales every gradient down by the same factor (Math Part 9 works an example). It returns the length before clipping, and train.py logs it every step: after the loss, it’s the most useful number in the log, because it jumps on exactly the steps where something went wrong. With clipping off, max_norm is infinity, so the norm is still logged.
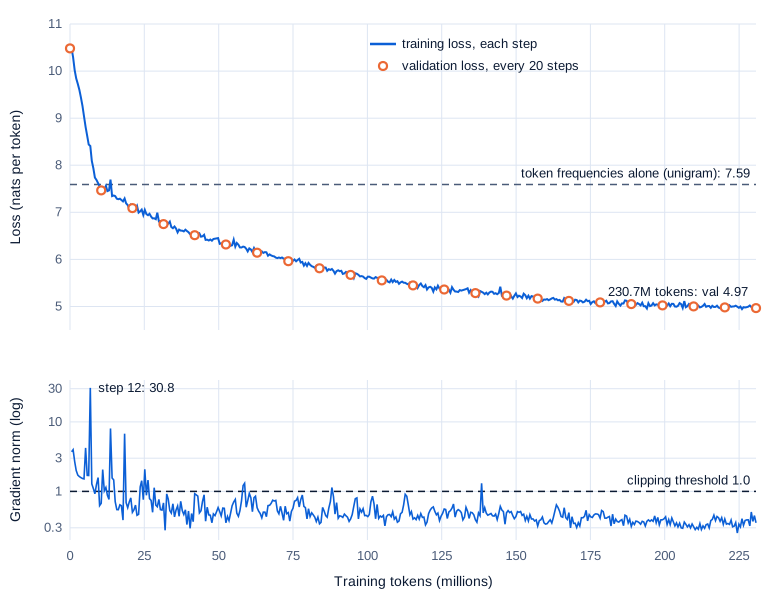
In the 22M run below, 33 of 440 steps had a norm above 1.0 and were clipped, 29 of them in the first 54 steps. The largest, 30.8 at step 12, was scaled down 31 times. After step 54 only four steps were clipped, none above 1.31, and the median norm drifted from 1.27 over the first 40 steps to 0.35 over the last 40.
BF16 autocast over FP32 master weights
The weights are FP32 (32-bit floats) and stay that way; AdamW updates them. Inside torch.autocast("cuda", dtype=torch.bfloat16), PyTorch runs matrix multiplications such as linear in BF16 on the tensor cores and keeps ops like softmax, cross_entropy and rsqrt in FP32, per its autocast op lists. Math Part 14 explains why the master copy must be FP32 (a BF16 weight can’t absorb an update smaller than about 1/256 of itself) and why FP16 training needs loss scaling. In PyTorch’s words, small gradients “will flush to zero (‘underflow’), so the update for the corresponding parameters will be lost.” BF16 has FP32’s 8-bit exponent and reaches down to about 10⁻³⁸; FP16 stops at 6 × 10⁻⁸.
How small are the gradients here? A hook on each of the 42 linear layers recorded the gradient flowing back into its BF16 output, for one real micro-batch of 16 × 1,024 tokens, with the loss divided by 32 as in training:
| Activation gradients, 22M model at initialization | Loss / 32 (as trained) | Loss not divided |
|---|---|---|
| Values recorded | 339,738,624 | 339,738,624 |
| Median size | 6.8 × 10⁻⁹ | 2.2 × 10⁻⁷ |
| Exactly zero in BF16 | 0.007% | 0.007% |
| Would round to zero in FP16 (below 2⁻²⁵) | 73.2% | 20.4% |
| Would be FP16 subnormals, with lost precision (below 2⁻¹⁴) | 100% | 99.1% |
| Same, after the 440-step run: would round to zero in FP16 | 77.4% | 16.7% |
They’re tiny because the loss is a mean over 16,384 positions, and accumulation divides by 32 more. In FP16, three quarters would vanish. In BF16 none did: the smallest nonzero value was 9 × 10⁻²⁰, far above BF16’s limit, so the 0.007% that are zero aren’t underflow. That’s why train.py has no GradScaler.
Gradient accumulation, checked numerically
backward() adds into .grad, so after 32 micro-batches each scaled by 1/32, the gradient is the mean over all 524,288 tokens, as one giant batch would give. This check runs in FP32 on the CPU, comparing one batch of 8 sequences of 128 tokens with 4 micro-batches of 2:
# accum_check.py (excerpt), run next to model.py and data.py
import torch
from data import ShardLoader
from model import GPT, SMALL

torch.manual_seed(0)
model = GPT(SMALL)
x, y = ShardLoader("train", B=8, T=128).batch(0)

def grads(micro, divide=True, targets=y):
    model.zero_grad(set_to_none=True)
    n = 8 // micro
    total = 0.0
    for i in range(n):
        sl = slice(i * micro, (i + 1) * micro)
        loss = model(x[sl], targets[sl])
        (loss / n if divide else loss).backward()
        total += loss.item() / n
    return total, torch.cat([p.grad.flatten() for p in model.parameters()])
loss: one batch 10.446156, mean of 4 micro-batches 10.446155
grad norm: one batch 8.031073, accumulated /4 8.031073, accumulated without /4 32.124290
largest difference, one batch vs accumulated: 2.98e-08 (largest gradient entry 7.96e-02); relative norm 2.13e-07
masked: one batch loss 10.459472, mean of micro-batch means 10.470995, relative gradient difference 3.96e-01The two gradients agree to 2 parts in 10 million, FP32 rounding from adding in a different order. Forgetting the division makes the gradient 4 times too long here, 32 times in the real run: Adam’s update barely notices a constant scale, but the logged norm becomes meaningless and clipping fires on every step.
The last line is a trap for Part 10. When targets are masked with ignore_index=-1, as fine-tuning does for prompt tokens, micro-batches average over different numbers of tokens, and the mean of their means is no longer the true mean. With a quarter of one micro-batch’s targets kept, the gradient was off by 40%. The fix is to divide by the step’s total count of real targets.
Step 5: validation, checkpoints and exact resume
Validation loss
Validation loss is measured on the 15 million tokens Part 3 held out. evaluate() always reads the same first 40 micro-batches, 655,360 tokens, so two evaluations differ only because the model changed. Evaluations and checkpoint saves together took 58 seconds of the 40-minute run below, 2.4%.
Checkpoints
A checkpoint holds the FP32 weights, AdamW’s state (both moving averages and a step count per tensor) and the step number: 264 MB for the 22M model, 1.06 GB for the 88M. The data and the learning rate need no state, because Part 3’s ShardLoader.batches(step) and lr_at(step) are pure functions of the step. save_checkpoint writes a temporary file and renames it, so a crash mid-save leaves the previous checkpoint intact. --keep-ckpts also keeps a weights-only snapshot each time, for later parts that study how the model changes.
Proving that resume is exact
Two runs of 20 short steps (4 micro-batches each): one straight through, one stopped at step 10 and resumed in a new process. With PyTorch’s default kernels they diverge, but so do two identical straight runs: by about 0.0001 at step 8, and up to 0.03 after a gradient spike at step 10. Some backward kernels add partial sums in whatever order GPU threads finish, the nondeterminism Part 4 met, so two runs can’t be compared exactly.
--deterministic turns on torch.use_deterministic_algorithms(True), which picks kernels that always add in the same order; here it ran at 95,000 to 99,000 tokens per second against 100,000 to 102,000. With it, two straight runs agree to the last bit, and so does the resumed one:
| Step | Straight through: loss | Stopped at 10, resumed: loss | Gradient norm identical |
|---|---|---|---|
| 9 | 7.829189777374268 | 7.829189777374268 | yes |
| 10 (first after resume) | 9.53160285949707 | 9.53160285949707 | yes |
| 11 | 7.892684459686279 | 7.892684459686279 | yes |
| 19 | 7.708744049072266 | 7.708744049072266 | yes |
All 20 steps match exactly, losses and gradient norms. Resuming with the weights but a fresh optimizer is not the same run: from step 11 the losses differed by up to 0.09, because Adam’s moving averages and its bias correction restart from zero.
Step 6: the first real loss curve
The 22M model from Part 4, trained by the command in Step 1 on the start of the training stream:
| Setting or result | Value |
|---|---|
| Model | 22,025,088 parameters (SMALL: width 384, 6 layers, 6 query and 2 key-value heads) |
| Batch | 524,288 tokens per step: 16 sequences × 1,024 tokens × 32 micro-batches |
| Steps and tokens | 440 steps, 230,686,720 tokens, 10.5 per parameter |
| Optimizer | AdamW, betas (0.9, 0.95), epsilon 10⁻⁸, weight decay 0.1 on matrices, clipping at 1.0 |
| Learning rate | peak 1.5 × 10⁻³, 20 warm-up steps, cosine to 1.5 × 10⁻⁴ at step 440 |
| Precision and flags | BF16 autocast over FP32 weights; --compile --fused; seed 1337 |
| Wall time | 39.7 minutes, including compilation, 23 evaluations and 11 checkpoints; not resumed |
| Throughput | median 99,489 tokens/s (range 94,338 to 101,899), 63% MFU |
| Peak GPU memory | 2.69 GiB |
| Validation loss | 10.48 at step 0, 7.47 at step 20, 5.96 at step 140, 4.97 at step 440 |
| Training loss, last 10 steps | 4.99 on average |
| GPU during the run | SM clock median 1,830 MHz (1,530 to 2,175), memory 7,000 MHz, power 48.7 W on average, power limit 42.5 to 50 W, 75 to 84 °C |
MFU (model FLOPs utilization) uses Part 1’s count, 160.5 million FLOPs per token for this model, so 99,489 tokens per second is 16.0 TFLOPS, 63% of the 25.3 TFLOPS GPU Part 4 measured. The machine is the series’ usual NVIDIA GeForce RTX 4060 Laptop GPU (8 GB) under WSL2, driver 592.82, PyTorch 2.11.0 with CUDA 12.8.
Swipe to pan the diagram, or tap it to zoom.
The dashed line is what a model that knows only how often each token occurs would score: 7.59 nats per token, the entropy of the validation set’s token frequencies. The model passes it at step 20, about 10 million tokens in; everything after that comes from context.
Validation tracks training within a few hundredths throughout. In a single pass over data every training batch is new text too, so there’s nothing to overfit yet.
The gradient norm shows what the loss hides: 30.8 at step 12, during warm-up, then 8.0 and 6.8 at steps 25 and 34, just after the peak. Clipping scaled those updates down, and the loss barely flinched (a one-step bump from 7.47 to 7.69 at step 25).
On the whole 15-million-token validation shard the final loss is 4.9725 (4.9657 on the 40-micro-batch subset): a model that has learned words, some grammar and little else. Greedy decoding from “The water cycle is” gives “a major part of the water. The water is a major part of the water, which is a major part of the water.” Part 7’s model gets 4 times the parameters and 7.6 times the tokens.
Step 7: ablations, or why each piece is there
Each ablation changes one thing and reruns a short job on the same data from step 0. At 26 million tokens or less they show early training only, and they’re single runs except where noted.
The learning-rate sweep
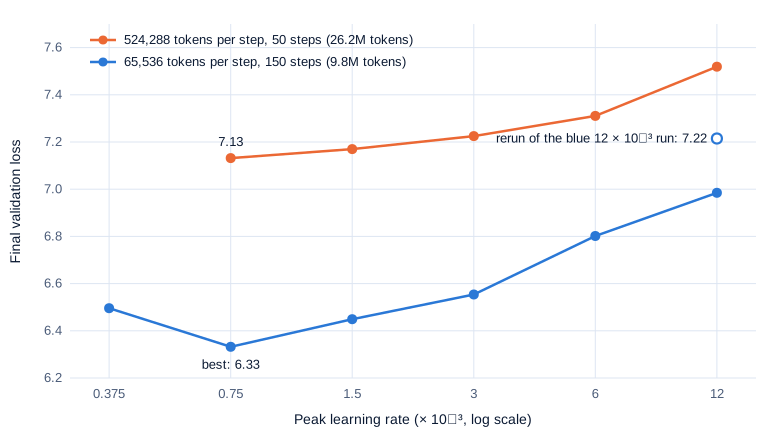
The first sweep used the run’s own 524,288-token batch: five peak rates, 50 steps each, each with its own complete schedule. It took 25 minutes and taught mainly how not to sweep. Every run ended between 7.13 and 7.52, barely below the unigram level of 7.59: fifty updates aren’t enough to get past that stage at any rate, so the lowest rate winning says nothing about the optimum.
The second sweep used 65,536 tokens per step (4 micro-batches) and 150 steps: three times the updates on a third of the tokens, two minutes per run. Now there’s a valley:
Swipe to pan the diagram, or tap it to zoom.
0.75 × 10⁻³ was best; halving or doubling it cost 0.12 to 0.17. But a second run of the 1.5 × 10⁻³ setting, same code, data and seed, ended at 6.33 instead of 6.45, and one at 12 × 10⁻³ at 7.22 instead of 6.98: nondeterministic GPU sums differ in the last bits, and early spikes amplify that. So the valley floor, 0.375 to 1.5 × 10⁻³, is flat within noise; only 6 × 10⁻³ and above are clearly worse.
The main run’s 1.5 × 10⁻³ was chosen beforehand from published small models: Pythia’s 70M model, with 18.9 million non-embedding parameters to our 9.4 million, used 1.0 × 10⁻³, and GPT-3 Small 6 × 10⁻⁴. It landed on the flat floor; whether a lower rate would win over 440 steps, short runs can’t say.
Too high a rate, warm-up and clipping
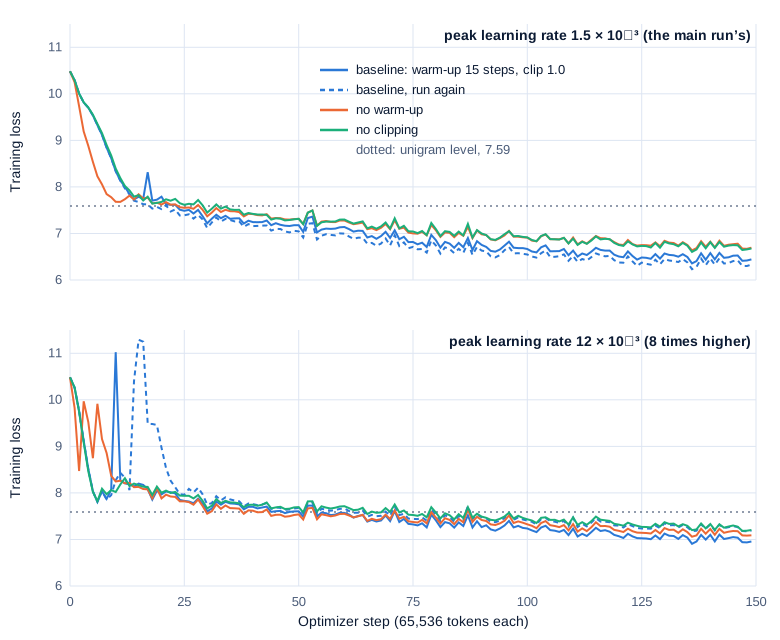
At 12 × 10⁻³, eight times the main run’s rate, training goes wrong in a way the final number understates. Both runs with warm-up and clipping hit a spike in which the loss climbed above its starting value: 11.02 at step 10 in one, and 11.29 at step 15 with a gradient norm of 96 in the other. After that, all the 12 × 10⁻³ runs hovered around the unigram level until steps 70 to 90, while the 1.5 × 10⁻³ runs were below it for good by step 24. Warm-up and clipping didn’t rescue them.
Swipe to pan the diagram, or tap it to zoom.
At the main run’s 1.5 × 10⁻³, removing either safeguard cost loss:
| Peak 1.5 × 10⁻³, 65,536 tokens per step, 150 steps | Validation loss at step 150 | Largest gradient norm |
|---|---|---|
| Warm-up 15 steps, clipping at 1.0 | 6.449 | 22.8 (clipped) |
| Same, run again | 6.335 | 4.7 |
| No warm-up | 6.715 | 17.9 at step 1 |
| No clipping | 6.691 | 12.6 at step 15, applied in full |
Without warm-up the loss falls faster at first, 7.68 at step 10 against 8.34, because every weight takes a full-size step while Adam’s estimates are still poor (Math Part 9: at step 1, barely half the weights move the right way). By step 30 it’s behind, and it ends 0.27 to 0.38 higher. Without clipping, the step-15 spike was applied in full, and the run ended 0.24 to 0.36 higher. Both gaps are about three times the 0.11 spread between the identical runs, which makes them suggestive for single runs.
At 12 × 10⁻³ the same two changes ended at 7.12 and 7.20, inside the 6.98 to 7.22 spread of the two baseline runs. When the rate is far too high, chaos swamps everything else, so pick the rate first.
Accumulation versus a smaller batch
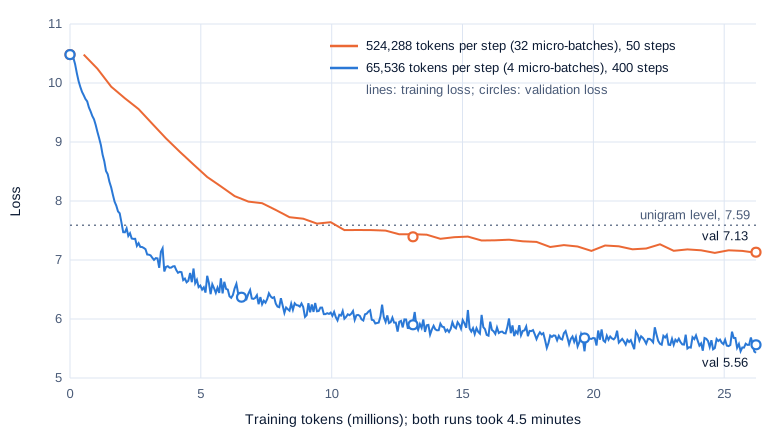
Accumulation lets a GPU that holds 16 sequences take steps of 512. It doesn’t make training faster: the same tokens take the same time as 50 big steps or 400 small ones. So which gives the better model per token? Two runs over the same 26.2 million tokens, at the same peak rate of 7.5 × 10⁻⁴ (best in both sweeps), 10% warm-up and a cosine to 10%: 50 steps of 524,288 tokens, or 400 steps of 65,536.
Swipe to pan the diagram, or tap it to zoom.
Both took 4.5 minutes, at 100,293 and 101,781 tokens per second. The small-batch run ended at 5.56; the accumulated one at 7.13. The main run, with its long schedule, needed 105 million tokens, four times as many, to reach the 5.55 the small batch reached in 26 million.
The series still accumulates to 524,288 tokens because the useful batch grows during training. Kaplan et al. (2020) measured a critical batch size, roughly the point past which more tokens per step stop saving steps, and found it “approximately doubles for every 13% decrease in loss,” fitting B_crit ≈ 2×10⁸ / L^(1/0.21) tokens. Applied to our losses only roughly (their text and tokenizer differ), that’s about 39,000 tokens at a loss of 6, 94,000 at 5, 272,000 at 4 and 513,000 at 3.5. Early on, a 524,288-token batch is 5 to 13 times past useful, which is the gap in the chart; later it fits. McCandlish et al. (2018) found the same: “the noise scale increases as the loss decreases over a training run.” GPT-3 ramped its batch “linearly from a small value (32k tokens) to the full value over the first 4-12 billion tokens of training.”
Step 8: the settings for Part 7
Part 7 trains the 88M model on 1.76 billion tokens. These are the settings this part’s measurements and sources point to:
| Setting | Part 7 (88M) | Why |
|---|---|---|
| Batch | 524,288 tokens: 16 × 1,024 × 32 | Part 1’s plan, and what GPT-3 Small and llm.c used at 124M. By the rough Kaplan estimate the useful batch reaches it around a loss of 3.5, so the cost is concentrated in the first few hundred steps |
| Steps and tokens | 3,360 steps, 1.76B tokens | Part 1’s budget: 20 tokens per parameter |
| Peak learning rate | 6 × 10⁻⁴ | GPT-3 Small, nanoGPT and llm.c at this batch for 124M models; the 22M sweeps found nothing better than 7.5 × 10⁻⁴, and the 88M model is twice as wide, which usually lowers the best rate |
| Warm-up | 150 steps (78.6M tokens, 4.5% of the run) | Every gradient norm above 2 in the 22M run came in its first 50 steps, during or just after a 20-step warm-up; llm.c warmed up for 3.7% of its run |
| Decay | Cosine to 6 × 10⁻⁵ at step 3,360 | Chinchilla: match the run length, decay 10 times |
| AdamW | Betas (0.9, 0.95), epsilon 10⁻⁸, weight decay 0.1 on all matrices including the tied embedding | GPT-3 and nanoGPT; Part 7 should watch the embedding’s norm, OLMo 2’s reason for exempting it |
| Clipping | 1.0 | GPT-3, Llama 2, Pythia; it clipped 33 steps of the 22M run |
| Precision | BF16 autocast, FP32 weights, no loss scaler | Step 4 |
| Flags | --compile --fused | Without compilation the 88M model fits only 4 sequences per micro-batch (Part 4) |
| Validation and checkpoints | Every 100 steps, 40 validation micro-batches; --keep-ckpts | A crash costs at most about 30 minutes; 34 weight snapshots of 352 MB each, 12 GB, for later parts |
A 4-step check of train.py on the 88M model with these flags ran at 29,380 to 29,901 tokens per second with 6.76 GiB peak memory, so 3,360 steps would take about 16.5 hours.
python train.py --model main --out runs/main88 --steps 3360 --warmup 150 --lr 6e-4 \
    --val-every 100 --ckpt-every 100 --keep-ckpts --compile --fused
In the real world
Our settings next to published small-model recipes:
| Run | Parameters | Tokens per step | Peak rate | Warm-up | Decay | Weight decay | Clipping |
|---|---|---|---|---|---|---|---|
| This part | 22M | 524,288 | 1.5 × 10⁻³ | 20 steps (10.5M tokens) | Cosine to 10% | 0.1, matrices | 1.0 |
| Part 7 plan | 88M | 524,288 | 6 × 10⁻⁴ | 150 steps (78.6M tokens) | Cosine to 10% | 0.1, matrices | 1.0 |
| GPT-3 Small | 125M | 0.5M, ramped up from 32K | 6 × 10⁻⁴ | 375M tokens | Cosine to 10% over 260B tokens | 0.1 | 1.0 |
| nanoGPT, GPT-2 config | 124M | 491,520 | 6 × 10⁻⁴ | 2,000 steps | Cosine to 6 × 10⁻⁵ at 600,000 steps | 0.1, 2D only | 1.0 |
| llm.c GPT-2 | 124M | 524,288 | 6 × 10⁻⁴ | 700 steps | To 0 | 0.1, 2D only | Not given in the post |
| Pythia-70M | 70M | 2,097,152 | 1.0 × 10⁻³ | 1% (1,430 steps) | Cosine to 10% | 0.01 | 1.0 |
Sources: GPT-3 (Table 2.1 and Appendix B), nanoGPT’s train.py, llm.c’s GPT-2 post, and Pythia (Table 1 and Appendix E).
- Pythia trained in FP16, with a dynamic loss scale starting at 2¹². nanoGPT creates its
GradScalerwithenabled=(dtype == 'float16'), a no-op in BF16. - OLMo 2 made two changes this part touches: no weight decay on embeddings, and an AdamW epsilon lowered from 10⁻⁵ to 10⁻⁸, the value
train.pyuses. It warms up for 2,000 steps at every size and clips at 1.0. - Wortsman et al. (2023) found that large-model instabilities “also appear in small models when training at high learning rates,” as the 12 × 10⁻³ runs above did.
- Chinchilla switched from Adam to AdamW because “this improves the language modelling loss and the downstream task performance after finetuning.”
Common misconceptions
- “A learning-rate sweep needs only a few steps.” Fifty steps of 524,288 tokens left every rate near the unigram level; the ranking measured start-up speed. Sweep with enough updates to pass the first plateau.
- “Gradient accumulation is free.” It costs no speed and gives the big batch’s exact gradient, but a big batch wastes tokens early: at equal tokens and time, 8 times smaller steps ended 1.57 lower.
- “BF16 needs loss scaling like FP16.” 77% of this model’s activation gradients sit below FP16’s smallest value; none come near BF16’s, which has FP32’s range.
- “Saving the weights is enough to resume.” With a fresh optimizer the losses diverged by up to 0.09. Weights, AdamW state and the step gave a bit-identical run.
- “One run per setting tells you which is better.” Identical reruns differed by 0.11 at a sensible rate and 0.23 at a high one, as much as some effects being tested.
Key takeaways
train.pyrepeats one step: 32 BF16 micro-batches with the loss divided by 32, one clip at a global norm of 1.0, one AdamW update of FP32 weights at a scheduled rate, one JSON log line.- The 22M model’s first real run went from 10.48 to 4.97 in validation loss on 230.7 million tokens in 40 minutes, at about 99,500 tokens per second and 63% MFU.
- Warm-up and clipping each earned about 0.3 in loss in short runs at the main rate; at a rate 8 times higher, the loss spiked above its starting value even with both.
- BF16 needs no loss scaler: 77% of the gradients would vanish in FP16, none in BF16. Resuming is exact to the last bit when the checkpoint holds the weights, the optimizer state and the step.
- Accumulating to 524,288 tokens matches the published recipes but wastes tokens early: a batch 8 times smaller was 1.57 better at equal tokens. Part 7 keeps the batch and uses a 6 × 10⁻⁴ peak with 150 warm-up steps.
What’s next
Every number in this part came from a training loop that runs at Part 1’s speed because of two flags. Part 6 takes them apart: what torch.compile, FlashAttention through PyTorch’s attention call, and the fused AdamW kernel each buy on this GPU, measured one at a time, and how close the 88M model’s step gets to the GPU’s peak before Part 7 commits 17 hours to it.
Further reading
- Language Models are Few-Shot Learners (Brown et al., 2020): Appendix B gives GPT-3’s AdamW settings, warm-up, cosine to 10%, clipping and batch-size ramp.
- Training Compute-Optimal Large Language Models (Hoffmann et al., 2022): Appendix B on matching the cosine cycle to the run and decaying 10 times.
- Scaling Laws for Neural Language Models (Kaplan et al., 2020): Section 5.1 fits the critical batch size as a function of loss.
- An Empirical Model of Large-Batch Training (McCandlish et al., 2018): the gradient noise scale, and why the useful batch grows during training.
- Decoupled Weight Decay Regularization (Loshchilov & Hutter, 2017): AdamW.
- Pythia: A Suite for Analyzing Large Language Models (Biderman et al., 2023): full training configurations for models from 70M parameters up, including FP16 loss scaling.
- 2 OLMo 2 Furious (OLMo team, 2024): why its embeddings get no weight decay, and other stability changes.
- Small-scale proxies for large-scale Transformer training instabilities (Wortsman et al., 2023): learning-rate sensitivity and instabilities reproduced in small models.
- PyTorch automatic mixed precision documentation: autocast’s op lists and why FP16 gradients need scaling.
- nanoGPT
train.py(Andrej Karpathy) and Reproducing GPT-2 (124M) in llm.c (Karpathy, 2024): the two closest public training loops, with their GPT-2 recipes.