
Build an LLM From Scratch · Part 9 of 15
Build an LLM From Scratch: Evaluating a Base Model
Perplexity, bits per byte and zero-shot multiple choice for the 88M model against GPT-2, Pythia and SmolLM2, with a harness checked against lm-eval.
On this page
TL;DR
This part measures what Part 7’s 88M model learned. Its perplexity, 28.9, can’t be compared with any other model’s. In bits per byte, which doesn’t depend on the tokenizer, it scores 1.045 on held-out FineWeb-Edu text, against 0.996 for GPT-2 small and 0.853 for SmolLM2-135M on the same text, and 1.231 on Wikipedia, behind even Pythia-70M. Answering multiple-choice questions by comparing log-probabilities, it gets 47.9% on ARC-Easy (GPT-2: 43.8%) but only 28.0% on HellaSwag (GPT-2: 31.1%, chance: 25%). A 215-line harness reproduces lm-evaluation-harness’s GPT-2 numbers to four decimals. Over training, the benchmarks sit at chance while the loss falls fastest, then climb steadily, with no sudden jumps.
Why it matters
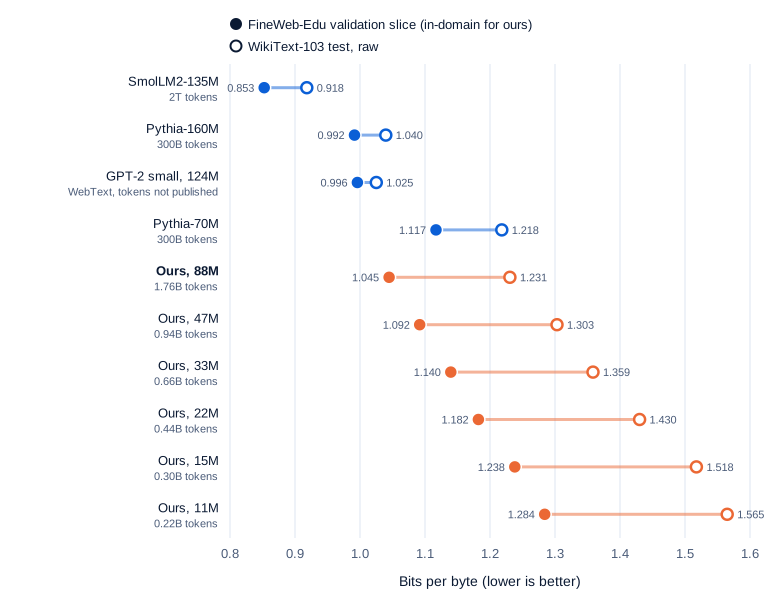
On WikiText-103, a standard set of Wikipedia articles, the 88M model has a perplexity of 34.1. Pythia-70M, a model EleutherAI trained on 300 billion tokens, has 44.5. By that number ours looks better, yet measured per byte of the same text Pythia-70M wins, 1.218 bits to 1.231.
A loss of 3.37 nats per token (Part 7) says the model improved, not how good it is next to anything else, or whether it can answer a question. Part 1 chose a model “close to GPT-2 small’s size, so its results can be compared with published small models.” This part makes those comparisons in units that survive a change of tokenizer, asks the model 14,256 multiple-choice questions, and checks the measuring tool before trusting it.
The intuition
Comparing perplexities across tokenizers is like comparing prices per pack in a shop where every brand packs a different weight. One brand’s pack costs less, but it holds less. Bits per byte is the price per kilo: divide everything by the same unit, the bytes of the text, and brands become comparable.
Multiple-choice benchmarks are a different test: a written exam after a reading course. The model doesn’t write an answer; you read each option aloud and watch how surprised it is.
The analogy breaks in two places. A byte isn’t a perfectly neutral unit: a Hindi letter takes three bytes and an English one takes one, so bits per byte still favors models whose training text resembles the test text. And an exam score depends on how you ask: the same model’s ARC-Easy score moves from 43.0% to 47.9% when you change how answers of different lengths are compared.
Step 1: perplexity, and why it doesn’t travel
Math Part 6 builds the loss from surprise. In short: the loss is the average of minus the log-probability the model gave each actual next token, in nats, and perplexity is e raised to the loss, the number of equally likely tokens the model is, on average, choosing between. Part 7’s final model scores 3.3651 on the whole 15-million-token validation shard, so its perplexity is e^3.3651 = 28.9.
The same arithmetic on Part 8’s five sweep models, on the same shard:
| Model | Training tokens | Validation loss (nats per token) | Perplexity | Bits per byte |
|---|---|---|---|---|
| 11M | 219M | 4.1201 | 61.6 | 1.304 |
| 15M | 295M | 3.9731 | 53.2 | 1.257 |
| 22M | 441M | 3.7973 | 44.6 | 1.201 |
| 33M | 659M | 3.6638 | 39.0 | 1.159 |
| 47M | 944M | 3.5135 | 33.6 | 1.112 |
| 88M | 1,762M | 3.3651 | 28.9 | 1.065 |
Within one tokenizer, perplexity ranks models correctly. Across tokenizers it can’t. A tokenizer that cuts text into longer pieces packs more text into each prediction, so each token is harder to guess even if the model predicts the text exactly as well. Ours splits WikiText’s 1,290,527 bytes into 311,838 tokens, Pythia’s into 287,150: 9% more predictions, each a little easier, and per-token perplexity rewards that.
Step 2: bits per byte, a fair comparison
The conversion
Bits per byte divides the total surprise by something every model agrees on: the UTF-8 bytes of the text. Take the total nats over the text, divide by ln 2 to get bits, and divide by the bytes:
bits per byte = (loss in nats per token × tokens) / ln 2 / UTF-8 bytesFor the whole validation shard: the 14,991,360 tokens Part 7 scored decode to 68,363,770 bytes, 4.56 bytes per token (Part 2 measured 4.61 on its own held-out set). So the 88M model’s 3.3651 nats per token is 3.3651 / 0.6931 / 4.560 = 1.065 bits per byte, the last column above. The Pile paper made this its preferred metric for its “invariance to different tokenization schemes.”
Same text, every model
The comparison needs every model to read exactly the same bytes, in the same way. The new module evals.py in the shared code folder does it in three functions. Here are two:
# evals.py (excerpt)
def rolling_requests(ids, max_len, stride):
    """Cover a document's tokens (ids[0] is the end-of-text start marker) with windows of at most
    max_len tokens of input. The first window scores all its tokens; each later one slides by
    `stride` and scores only its new tokens, so each token is scored once, with at least
    max_len - stride tokens of context once past the first window."""
    if len(ids) <= max_len + 1:
        return [(ids, len(ids) - 1)]
    reqs, end = [(ids[:max_len + 1], max_len)], max_len + 1
    while end < len(ids):
        new_end = min(end + stride, len(ids))
        reqs.append((ids[new_end - max_len - 1:new_end], new_end - end))
        end = new_end
    return reqs


def bits_per_byte(lm, docs, stride=512):
    """Total nats over the text / ln 2 / UTF-8 bytes of the same text. Each document is scored on
    its own, after the model's end-of-text token, with a sliding window of lm.max_len tokens."""
    reqs, n_tok, n_bytes = [], 0, 0
    for text in docs:
        ids = [lm.eot] + lm.encode(text)
        reqs += rolling_requests(ids, lm.max_len, stride)
        n_tok, n_bytes = n_tok + len(ids) - 1, n_bytes + len(text.encode("utf-8"))
    nats = -sum(score(lm, reqs))
    return {"nats": nats, "tokens": n_tok, "bytes": n_bytes, "loss": nats / n_tok,
            "perplexity": math.exp(nats / n_tok), "bytes_per_token": n_bytes / n_tok,
            "bpb": nats / math.log(2) / n_bytes}
The third, score, sorts the windows by length, packs them into batches with padding on the right, and sums the log-probabilities of the scored tokens. OurLM and HFLM wrap our model and any Hugging Face model behind the same three things: encode, the end-of-text id eot, and logprobs.
The choices, and why they’re fair:
- Each document is scored on its own, after the model’s own end-of-text token. All four model families separate training documents with one, so each model starts a document the way it trained. The end-of-text token is never scored; it has no bytes.
- Every model gets a 1,024-token window, the limit for ours and GPT-2. Pythia allows 2,048 and SmolLM2’s config 8,192, but extra context would lower their scores for reasons unrelated to how well they model text. The tokenizers differ by under 2% in bytes per token on this text, so 1,024 tokens covers about the same text for each.
- Longer documents get windows that slide 512 tokens at a time and score only their new tokens, so every token past the first window has at least 512 tokens of context. 529 of the 2,014 FineWeb-Edu documents needed it.
- The in-domain text is the first 2,014 documents of Part 3’s validation shard, decoded back to text: 9,143,418 bytes, a random sample since Part 3 shuffled the documents. The first 200 match the original downloads byte for byte. The out-of-domain text is the raw WikiText-103 test split, 62 Wikipedia articles and 1,290,527 bytes, quirks included (
@-@for hyphens, spaces before punctuation). - Our models run with BF16 autocast, as in training; the Hugging Face models in FP32, for a reason given below.
Run from the folder that holds runs/main88, with the shared code on the path:
from evals import OurLM, HFLM, fineweb_val_docs, bits_per_byte

docs = fineweb_val_docs()                  # 2,014 validation documents, 9.14 MB of text
for lm in (OurLM("runs/main88/model_03360.pt"), HFLM("openai-community/gpt2")):
    r = bits_per_byte(lm, docs)
    print(f"{r['tokens']:,} tokens  {r['bytes_per_token']:.3f} bytes/token  loss {r['loss']:.4f}  bpb {r['bpb']:.4f}")
2,000,559 tokens 4.570 bytes/token loss 3.3095 bpb 1.0447
1,972,642 tokens 4.635 bytes/token loss 3.2001 bpb 0.9960The 88M model scores 1.045 here, against 1.065 on the whole shard. The difference is method: val_loss cuts the token stream into fixed 1,024-token rows, so many tokens get little context and each document’s first token is guessed from the end of the previous one. Every model below is scored this way, so compare them with each other, not with Part 7’s numbers.
Ten models on two texts
| Model | Parameters | Training tokens | Tokenizer vocabulary | FineWeb-Edu bpb | WikiText bpb | WikiText perplexity |
|---|---|---|---|---|---|---|
| Ours, 11M | 10.9M | 219M | 32,768 | 1.284 | 1.565 | 89.0 |
| Ours, 22M | 22.0M | 441M | 32,768 | 1.182 | 1.430 | 60.5 |
| Ours, 47M | 47.2M | 944M | 32,768 | 1.092 | 1.303 | 42.0 |
| Ours, 88M | 88.1M | 1.76B | 32,768 | 1.045 | 1.231 | 34.1 |
| Pythia-70M | 70.4M | 300B | 50,304 | 1.117 | 1.218 | 44.5 |
| GPT-2 small | 124.4M | not published | 50,257 | 0.996 | 1.025 | 24.6 |
| Pythia-160M | 162.3M | 300B | 50,304 | 0.992 | 1.040 | 25.5 |
| SmolLM2-135M | 134.5M | 2T | 49,152 | 0.853 | 0.918 | 15.0 |
Parameter counts include embeddings and come from the loaded models; Pythia’s input and output embeddings are separate tables, so both count. The 15M and 33M models sit between their neighbors (1.238 and 1.140 on FineWeb-Edu) and appear in the chart.
Swipe to pan the diagram, or tap it to zoom.
Our models lose far more on Wikipedia than the published ones. GPT-2’s two scores differ by 0.029 bits per byte, although, per its model card, “all Wikipedia pages were removed” from its training data. Ours differ by 0.186.
What training data does to these numbers
On FineWeb-Edu, the source of its own training data, the 88M model beats Pythia-70M, which trained on 170 times as many tokens of the Pile, a mix of web text, books, code, papers and Wikipedia. On Wikipedia, Pythia-70M pulls ahead. The tokenizer shows the same narrow diet: ours compresses WikiText’s raw format to 4.14 bytes per token, 9% worse than FineWeb-Edu’s 4.57, while GPT-2’s loses 3% (4.64 to 4.51).
GPT-2 small and Pythia-160M, with 1.4 and 1.8 times our parameters, beat our model by about 0.05 even on its home text. SmolLM2-135M beats everything: its model card lists 2 trillion training tokens from FineWeb-Edu, DCLM, The Stack and others, 1,100 times our data, including our validation text’s source.
A check on precision
It’s tempting to evaluate every model in BF16 (bfloat16, a 16-bit format with 8 bits of precision), as our models trained. For GPT-2 it barely mattered: 0.996 bits per byte in FP32, 1.000 under BF16 autocast, headline benchmark scores within 0.4 points. For Pythia-70M it was a disaster: 1.117 became 1.653 bits per byte, and ARC-Easy fell from 37.5% to 30.1%. A CPU rerun on 12 documents agreed (3.68 nats per token in FP32, 5.42 in BF16). Pythia’s config lists FP16, which has 3 more bits of precision than BF16; which layer breaks wasn’t traced. Every Hugging Face number here is FP32, HFLM’s default.
Step 3: multiple choice without generating
Scoring the options
A base model has never been taught to answer questions, but it can still take a multiple-choice test. Append each option to the question, compute the log-probability of the option’s tokens given everything before them, and pick the option the model finds least surprising. Nothing is generated.

Swipe to pan the diagram, or tap it to zoom.
The raw sum has a bias: every token costs some surprise, so short options win. “Sunlight” wins here mostly because it’s short. Dividing by length removes most of that bias: per character, “water pollution” costs 0.93 nats and “sunlight” 1.57.
EleutherAI’s open-source lm-evaluation-harness reports both. Its task guide calls the second “acc_norm (length-normalized accuracy),” and Leo Gao’s 2021 post describes it as “computing average log probability per byte, which ensures that it is tokenization agnostic.” The code divides by the option’s length in characters, which equals its length in bytes for plain ASCII text:
# lm_eval/api/task.py, version 0.4.13 (excerpt)
completion_len = np.array([float(len(i)) for i in choices])
pred = np.argmax(lls)
pred_norm = np.argmax(lls / completion_len)
GPT-3 used other rules (per token for most tasks, and for ARC a ratio against each answer’s probability after a generic “Answer:”), so its numbers don’t line up with either. And since Part 2’s tokenizer makes " Paris" and "Paris" different tokens, an option must be tokenized as the model would read it in running text. evals.py copies the harness’s rule:
# evals.py (excerpt)
def encode_pair(lm, context, continuation):
    """lm-eval-harness's rule: encode context + continuation together, then split, so the
    continuation's tokens are the ones the model would actually read."""
    whole = lm.encode(context + continuation)
    return whole, len(whole) - len(lm.encode(context))
Three benchmarks
Benchmarks for 50-160M models must be easy enough to clear chance by more than the noise. Three qualify, run in the harness’s prompt formats:
| Benchmark | What it asks | Split used | Items | Options | Chance | License |
|---|---|---|---|---|---|---|
| HellaSwag | Pick the right ending for an ActivityNet video caption or a WikiHow passage | validation | 10,042 | 4 | 25% | MIT, per its card |
| ARC-Easy | Grade-school science questions | test | 2,376 | 3 to 5, mostly 4 | 25.0% | CC BY-SA 4.0 |
| PIQA | Which of two solutions achieves a physical goal | validation | 1,838 | 2 | 50% | Academic Free License 3.0 |
HellaSwag’s wrong endings were written by a language model and kept only if they fooled a classifier; its paper calls the questions “trivial for humans (>95% accuracy),” and PIQA’s authors say “humans find the dataset easy (95% accuracy).” ARC-Easy’s chance is the mean of 1/options, 25.02%. Each accuracy gets a 95% confidence interval from the binomial standard error, ±1.96 × sqrt(p(1 − p)/n): ±0.9 points on HellaSwag, ±2.0 on ARC-Easy, ±2.2 on PIQA.
from evals import OurLM, load_task, score_task, summarize

lm = OurLM("runs/main88/model_03360.pt")
for task in ("hellaswag", "arc_easy", "piqa"):
    s = summarize(score_task(lm, load_task(task)))
    print(f"{task:10} acc {s['acc']:.4f} ± {s['acc_ci']:.4f}  acc_norm {s['acc_norm']:.4f} ± {s['acc_norm_ci']:.4f}")
hellaswag acc 0.2730 ± 0.0087 acc_norm 0.2795 ± 0.0088
arc_easy acc 0.4785 ± 0.0201 acc_norm 0.4297 ± 0.0199
piqa acc 0.6023 ± 0.0224 acc_norm 0.5854 ± 0.0225Results, zero-shot
| Model | HellaSwag acc_norm | ARC-Easy acc | PIQA acc |
|---|---|---|---|
| Chance | 25.0 | 25.0 | 50.0 |
| Ours, 11M | 26.4 ± 0.9 | 36.6 ± 1.9 | 56.0 ± 2.3 |
| Ours, 22M | 26.7 ± 0.9 | 39.3 ± 2.0 | 57.2 ± 2.3 |
| Ours, 47M | 27.2 ± 0.9 | 45.1 ± 2.0 | 58.9 ± 2.2 |
| Ours, 88M | 28.0 ± 0.9 | 47.9 ± 2.0 | 60.2 ± 2.2 |
| Pythia-70M | 27.4 ± 0.9 | 37.5 ± 1.9 | 59.9 ± 2.2 |
| GPT-2 small | 31.1 ± 0.9 | 43.8 ± 2.0 | 62.9 ± 2.2 |
| Pythia-160M | 30.3 ± 0.9 | 43.6 ± 2.0 | 62.3 ± 2.2 |
| SmolLM2-135M | 43.1 ± 1.0 | 64.4 ± 1.9 | 68.4 ± 2.1 |
The columns follow the usual convention: acc_norm for HellaSwag, acc for the other two. The 88M model sits 3 points above chance on HellaSwag and 3 below GPT-2. On ARC-Easy it beats GPT-2 and Pythia-160M by 4 points. That’s the training data again: the FineWeb paper found FineWeb-Edu’s educational filter lifted its 1.71B test models’ ARC score “from 46% to 57%.”
The metric isn’t neutral either. On ARC-Easy, acc beats acc_norm for every model in the table; on HellaSwag, acc_norm wins for every model. Picking the better one per model would be cherry-picking.
Zero-shot and few-shot
Few-shot prompting puts k solved examples, separated by blank lines, before the question. Our window caps k: a solved ARC-Easy example averages 31 of our tokens and a HellaSwag one 44, so about 30 or 20 fit in 1,024 tokens. GPT-3 used 50 for ARC, in a 2,048-token window.
For the 88M model, examples hurt. ARC-Easy fell from 47.9% with none to 44.7% with one and 45.2% with five (score_task(lm, items, k=5, train=load_task("arc_easy", "train")), examples drawn from the training split with a fixed seed). That’s about one and a half intervals, partly noise perhaps, but no gain. The GPT-3 paper’s Table H.1 shows the same for its 125M model: 33.7 zero-shot and 33.5 few-shot on HellaSwag, 43.6 and 42.7 on ARC-Easy, 64.6 and 64.3 on PIQA. Small models barely learn from examples in the prompt.
Checking the harness
A homemade harness is a new source of error, so evals.py was run against the real one: lm-evaluation-harness 0.4.13 on GPT-2 small, FP32, zero-shot, on the same three tasks.
| GPT-2 small | lm-evaluation-harness 0.4.13 | evals.py |
|---|---|---|
| HellaSwag acc / acc_norm | 0.2892 / 0.3114 | 0.2892 / 0.3114 |
| ARC-Easy acc / acc_norm | 0.4381 / 0.3948 | 0.4381 / 0.3948 |
| PIQA acc / acc_norm | 0.6289 / 0.6251 | 0.6289 / 0.6251 |
Every number matches to four decimals. Across all 14,256 questions, the two harnesses’ log-likelihoods differ by at most 0.00037 nats and never pick a different option. That’s by construction: same datasets, prompts, tokenization rule and normalization. Change any one and the numbers move, which is why published scores differ:
- The Pythia paper’s Table 7, made with an older version of the same harness, gives Pythia-70M 0.374 ± 0.010 on ARC-Easy and 0.595 ± 0.011 on PIQA, and Pythia-160M 0.435 and 0.627. Ours: 0.375, 0.599, 0.436 and 0.623, all within the paper’s error bars. (The paper’s ± is one standard error; this article’s are 95% intervals.)
- SmolLM2-135M’s card reports 68.4 on PIQA, as here, and 42.1 on HellaSwag against our 43.1. The card’s numbers come from a different tool, lighteval, so its prompts and normalization need not match these.
All the evaluation in this part, 63 minutes of GPU time, ran on the NVIDIA GeForce RTX 4060 Laptop GPU (8 GB), driver 592.82, PyTorch 2.11.0 with CUDA 12.8 and Transformers 5.20.2. The SM clock’s median was 1,845 MHz (90% between 1,455 and 2,115), the memory clock moved between 5,870, 7,000 and 8,000 MHz, and power averaged 49.4 W; nvidia-smi didn’t report a power limit during these runs. Clocks affect only the timings. The full suite took 2.5 minutes for the 88M model in BF16 and 7.4 minutes for GPT-2 in FP32.
Step 4: what training bought
Over training and over size
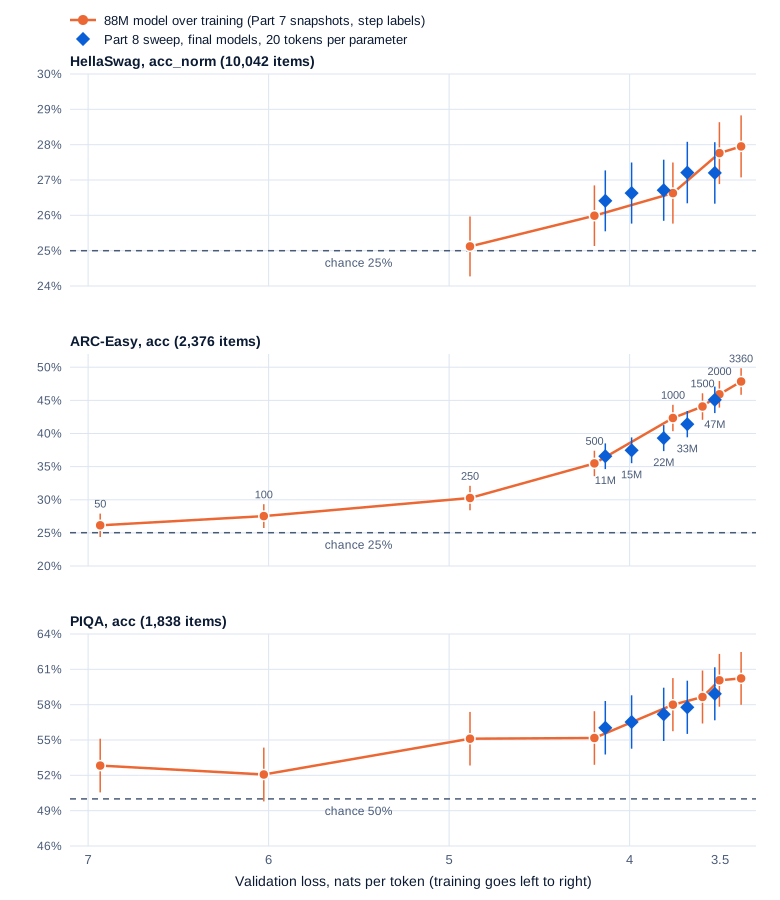
Part 7 saved the 88M model’s weights along the way, and Part 8 trained five smaller models to 20 tokens per parameter. Putting both on one axis, validation loss, shows how benchmark scores follow the loss:
Swipe to pan the diagram, or tap it to zoom.
Benchmarks lag the loss. By step 250, after 7% of the tokens, the loss had covered 79% of its total drop (Part 7), but ARC-Easy had gained only 5 of its eventual 23 points above chance, and HellaSwag none. Most benchmark gains came in the loss curve’s long tail, where 500 steps took off a few hundredths of a nat.
And at equal loss, it barely matters how the loss was reached. The 88M model at step 1,000 (loss 3.76) and the finished 22M and 33M models (3.81 and 3.68) score within one or two intervals of each other on all three benchmarks.
Where each benchmark lifts off chance
Lift-off here means the 95% interval no longer contains chance:
| Benchmark | Last snapshot at chance | First clearly above chance | Validation loss there |
|---|---|---|---|
| ARC-Easy | step 50 (26.1 ± 1.8) | step 100 (27.5 ± 1.8), clearly by step 250 (30.3) | 6.03, 4.88 |
| PIQA | step 100 (52.1 ± 2.3); step 50’s 52.8 ± 2.3 had barely cleared it | step 250 (55.1 ± 2.3) | 4.88 |
| HellaSwag | step 250 (25.1 ± 0.9) | step 500 (26.0 ± 0.9), clearly by 1,000 (26.6) | 4.19, 3.76 |
HellaSwag needs the most: a loss below about 4.2 nats, 260 million tokens in, before the model beats chance. The finished 11M model, at 4.13, clears it by 1.4 points.
Is the rise smooth?
Abilities that appear suddenly at some scale are called emergent. Schaeffer, Miranda and Koyejo (2023) argued that many reported jumps come from “the researcher’s choice of metric”: “nonlinear or discontinuous metrics produce apparent emergent abilities, whereas linear or continuous metrics produce smooth, continuous, predictable changes in model performance.” Their examples of the first kind are “Multiple Choice Grade,” which is 1 when the most probability is on the right option and 0 otherwise, and exact string match.
Accuracy here is a Multiple Choice Grade averaged over thousands of items. A continuous alternative is the probability on the correct option, with the options rescaled to sum to 1. For ARC-Easy, accuracy goes 30.3, 35.5, 42.3, 45.9, 47.9 from step 250 to 3,360, and that probability goes 29.8, 34.0, 39.2, 42.1, 44.1. Both rise steadily; neither jumps. What isn’t smooth is the relation to the loss: flat while the loss falls fastest, steady while it barely moves. That’s why Part 8 fitted its power law to the loss, not to a benchmark that sits near 25% for most of training.
Step 5: what these numbers can’t tell you
Contamination
A benchmark measures generalization only if the model didn’t train on its questions. When it did, that’s benchmark contamination, and HellaSwag’s passages come partly from WikiHow pages, which are on the web. The cheap check is the GPT-3 paper’s: an item is dirty “if it has a single N-gram collision with any document in our training corpus.” A short script hashed every run of 13 consecutive tokens in each item’s question and correct answer and searched all 1,761,607,680 tokens Part 7 trained on, in 3.5 minutes on the CPU.
| Test set | Items | Flagged | 88M accuracy, clean items | 88M accuracy, flagged items |
|---|---|---|---|---|
| HellaSwag | 10,042 | 69 (0.7%) | 27.9% | 30.4% (n = 69) |
| ARC-Easy | 2,376 | 15 (0.6%) | 47.9% | 46.7% (n = 15) |
| PIQA | 1,838 | 7 (0.4%) | 60.1% | 85.7% (n = 7) |
| WikiText-103 test | 62 articles | 30 | 0.76% of all 13-grams found |
The worst HellaSwag item, a WikiHow passage on how to be wittier, had 74% of its 13-grams in the training data: that page was trained on. One WikiText article had 18%. But the flagged sets are too small to move any total; clean accuracies match the overall ones within 0.1 points. A 13-gram match misses paraphrases and catches common phrases; better detection is a topic for Measuring LLMs Part 5.
Error bars
Two models on 2,376 ARC-Easy items need to differ by nearly 3 points before the gap is clearly more than question sampling. GPT-2 and Pythia-160M differ by 0.2 points on ARC-Easy and 0.6 on PIQA: tied. Our 88M’s 4.0-point lead over GPT-2 on ARC-Easy is real; our 47M’s 1.3 isn’t. The intervals cover only which questions were sampled; prompt format, normalization and few-shot seeds add variation they don’t show. Paired tests on the same items are tighter; Measuring LLMs covers them.
What isn’t measured
None of this asks the model to write anything. Part 7’s samples showed the 88M model inventing “Charles Columbus”; no number here captures fluency, factual accuracy in generated text, following instructions or multi-step reasoning. And each benchmark is a narrow slice: sentence endings, physical how-to, school science. A base model’s scores describe what it absorbed from its data; how it behaves as an assistant is a separate question.
In the real world
- WikiText-103’s articles are Wikipedia’s Good and Featured articles, and its paper (Merity et al., 2016) ran them through “the Moses tokenizer (Koehn et al., 2007), slightly augmented to further split numbers (8,600 → 8 @,@ 600).” That is where the raw form’s
@,@and spaced punctuation come from, and why a tokenizer trained only on web pages finds it foreign. - The FineWeb paper found that its FineWeb-Edu models “favour sources containing Wikipedia (WikiText-103 and M2D2 Wikipedia)” compared with models trained on FineWeb. At 1.76 billion tokens our model shows no such advantage; SmolLM2, at 2 trillion, loses only 0.065 bits per byte between the two texts.
- The GPT-3 paper’s contamination table found 2% of HellaSwag and 29% of PIQA overlapping its training data, and reported score changes between clean and full sets of 0% and −4%.
- HellaSwag’s GitHub repository has been unavailable since September 2026, when GitHub honored a DMCA notice from wikiHow alleging that datasets built by scraping its site distribute “unauthorized copies of our copyrighted material.” Copies such as the Hugging Face one used here remain online.
Common misconceptions
- “Lower perplexity means a better model.” Only with the same tokenizer and the same text. On WikiText, the 88M model’s perplexity is 34.1 and Pythia-70M’s is 44.5, but per byte Pythia-70M is better, 1.218 to 1.231.
- “Bits per byte makes every comparison fair.” It removes the tokenizer, not the training data. Our model beats Pythia-70M on FineWeb-Edu and loses to it on Wikipedia, by changing only the text.
- “A few examples in the prompt always help.” For the 88M model, ARC-Easy fell from 47.9% to 45.2% with five. GPT-3’s 125M model also scored slightly lower few-shot on all three benchmarks.
- “Length-normalized accuracy is the better metric.” It wins on HellaSwag for every model here and loses on ARC-Easy for every model here. Pick one per benchmark in advance and report it for everyone.
- “Evaluating in BF16 is as safe as training in it.” For GPT-2 it moved bits per byte by 0.4%. For Pythia-70M it raised it by 48% and cost 7 points on ARC-Easy.
- “Benchmark scores jump when an ability emerges.” Over training and over size, every benchmark here rose steadily, measured by accuracy or by a continuous probability.
Key takeaways
- Perplexity can’t be compared across tokenizers. Bits per byte can: total nats over the text, divided by ln 2 and by the text’s UTF-8 bytes. The 88M model’s 3.3651 nats per token is 1.065 bits per byte on the whole validation shard.
- On the same FineWeb-Edu text, the 88M model scores 1.045 bits per byte: better than Pythia-70M, about 0.05 behind GPT-2 small and Pythia-160M, and well behind SmolLM2-135M, which trained on 1,100 times more data. On Wikipedia it falls behind all four.
- A base model answers multiple choice by comparing the log-likelihoods of the options. Zero-shot, the 88M model gets 47.9% on ARC-Easy, ahead of GPT-2’s 43.8%, and 28.0% on HellaSwag, behind GPT-2’s 31.1%, with intervals of ±2.0 and ±0.9 points.
- A 215-line harness reproduced lm-evaluation-harness’s GPT-2 numbers exactly by copying its prompts, tokenization and normalization. Those choices, and numeric precision, can move scores more than the gaps between models.
- Benchmarks stay at chance while the loss falls fastest, then rise steadily with no jumps. At equal loss, a small finished model and a large unfinished one score alike.
What’s next
The 88M model can now be measured, and it still only continues text. Part 10 turns it into a chat model with supervised fine-tuning: a chat template built on the special tokens Part 2 reserved, loss masking so the model learns only from the assistant’s replies, and instruction data, then the same benchmarks to see what the new skill costs.
Further reading
- The Pile: An 800GB Dataset of Diverse Text for Language Modeling (Gao et al., 2020): bits per byte as the preferred metric, and GPT-2 and GPT-3 scored on 22 domains.
- Are Emergent Abilities of Large Language Models a Mirage? (Schaeffer, Miranda and Koyejo, 2023): how discrete metrics manufacture sudden jumps.
- Pythia: A Suite for Analyzing Large Language Models Across Training and Scaling (Biderman et al., 2023): Appendix G’s benchmark tables for every size, and checkpoints for studying training.
- Language Models are Few-Shot Learners (Brown et al., 2020): zero-, one- and few-shot evaluation, Table H.1 for every size, and Appendix C’s contamination study.
- lm-evaluation-harness (EleutherAI) and Multiple Choice Normalization in LM Evaluation (Gao, 2021): the reference harness and the four ways to compare options of different lengths.
- HellaSwag (Zellers et al., 2019), Think you have Solved Question Answering? Try ARC (Clark et al., 2018) and PIQA (Bisk et al., 2019): the three benchmarks and how they were built.
- The FineWeb Datasets (Penedo et al., 2024): the educational filter behind our training data, and its effect on ARC and MMLU.
- SmolLM2-135M model card (Hugging Face): a 135M model trained on 2 trillion tokens, and its benchmark table.
- Pointer Sentinel Mixture Models (Merity et al., 2016): the paper that introduced WikiText-103.