
Build an LLM From Scratch · Part 6 of 15
Build an LLM From Scratch: Making Training Fast on One GPU
From 5,800 to 30,000 tokens per second on a laptop GPU: TF32, BF16, FlashAttention, torch.compile, fused AdamW and batch size, each measured on its own.
On this page
TL;DR
Run as plain FP32 PyTorch, the series’ 88M-parameter model trains at 5,783 tokens per second on the laptop’s RTX 4060, so Part 7’s 1.76-billion-token run would take 3.5 days. Changing one setting at a time and timing full optimizer steps: TF32 matmuls reach 8,545 tokens per second, BF16 autocast 19,808, torch.compile 29,021, and 16 sequences per micro-batch about 30,000. That’s 74% of the GPU’s measured peak and about 17 hours for Part 7. The attention kernel matters only if you pick a bad one. Fused AdamW, pinned memory, CUDA graphs and gradient accumulation each move the step by less than the laptop’s own clock drift. What’s left is two thirds matrix multiplies running at 94% of the roof, with a ceiling about 30% higher.
Why it matters
The same 179 lines of model code, on the same laptop, can train at 5,800 tokens per second or at 30,000. The slow version needs 85 hours for Part 7’s run. The fast one needs 17. The model’s code stays the same throughout; what changes is how PyTorch runs it on the GPU.
Part 1 sized the model from a throughput measured with every speed setting already on, and Part 4 matched it. Neither said which settings did the work. Part 5’s training script has flags for them, and Part 7 needs to know which to turn on. GPU Part 9 measured fusion, torch.compile and CUDA graphs on single layers, and GPU Part 10 built a FlashAttention kernel. This part puts them into a full training step, backward pass and optimizer included, where the proportions are different.
The intuition
Think of a bakery with one very fast oven. The oven is the GPU’s tensor cores, the units that do matrix multiplication. Everything else in the bakery is either feeding the oven or getting in its way.
Some changes make the oven itself faster: baking at a lower temperature that it handles twice as quickly, which is what a 16-bit number format does. Some cut the walking: instead of carrying each tray to the shelf and back between steps, do three steps at the bench before anything goes back on the shelf. That’s kernel fusion, and the shelf is the GPU’s memory. And some changes speed up a job that takes a minute a day, like a faster cash register when the queue is at the oven.
The analogy breaks in one place. A real oven runs at a fixed speed. This GPU changes its clock every second to stay under a power limit that itself drifts between 40 and 50 watts, by more than some of the changes below.
How the measurements were taken
Every number here is a full optimizer step of the 88M model, model.py from Part 4 unchanged, at Part 1’s batch of 524,288 tokens (512 sequences of 1,024 tokens), reading real FineWeb-Edu tokens from Part 3’s ShardLoader. A step runs as several micro-batches, small groups of sequences that each do a forward and backward pass, whose gradients add up before one AdamW update; that’s gradient accumulation. Each step also clips the gradient norm to 1.0 and reads the loss back to the CPU once, as a logger would.
Each configuration ran in its own process: four micro-batches and one optimizer step to warm up (compilation happens here), then three timed steps, wall-clock with torch.cuda.synchronize() on both sides, median reported; the three differed by 2% at most. Peak memory is torch.cuda.max_memory_allocated(). nvidia-smi logged clocks, power draw and power limit every second. The machine is the series’ NVIDIA GeForce RTX 4060 Laptop GPU (8 GB, 24 SMs) under WSL2, driver 592.82, PyTorch 2.11.0 with CUDA 12.8, Triton 3.6.0. The benchmark script imports model.py and data.py without changing them; attention variants are patched in inside its own process.
MFU, defined
MFU (model FLOPs utilization) is the share of the GPU’s peak arithmetic rate that goes into the model’s own math. The PaLM paper, which named it, defines it as “the ratio of the observed throughput (tokens-per-second) relative to the theoretical maximum throughput of a system operating at peak FLOPs,” where the maximum counts only the work a forward and backward pass needs. For a decoder-only model, PaLM’s Appendix B counts:
FLOPs per token = 6N + 12·L·H·Q·T
                = 6 × 88,096,512 + 12 × 10 × 12 × 64 × 1,024
                = 528.6 M (weights) + 94.4 M (attention scores) = 622.95 M
MFU = tokens per second × 622.95 M / peak FLOPS
Here N is the parameter count, L the layers, H the query heads, Q the head size and T the sequence length. 6N is two FLOPs per weight per token forward and four backward; the second term is attention’s two weightless matrix multiplies (Part 1 derived it).
The peak is the hard part on a laptop. This article uses 25.3 TFLOPS, the BF16 rate GPU Part 4 measured with a large cuBLAS matmul. The spec sheet implies 29.1 TFLOPS: the Ada whitepaper’s per-SM BF16 rate (dense, FP32 accumulate) times 24 SMs times the 2,370 MHz boost clock, which this GPU never holds under load. Every table gives MFU against 25.3; divide by 1.15 for the spec figure. At 25.3 TFLOPS the ceiling is 25.3 × 10¹² / 622.95 × 10⁶ = 40,613 tokens per second.
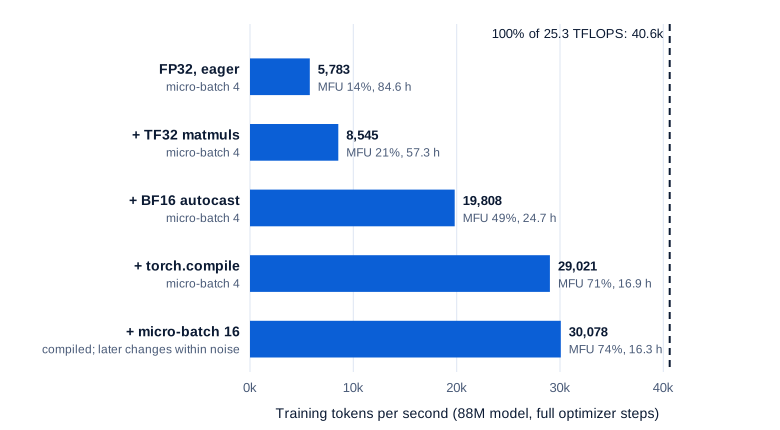
Swipe to pan the diagram, or tap it to zoom.
BF16 is the largest single step of the 5.2-fold gain, and TF32 and compilation are worth about 1.5 times each; the steps below take them one at a time.
Step 1: the number format
The first three rows change only how numbers are stored and multiplied:
| Configuration | Micro-batch × steps | Tokens/s | Step time | Peak memory | MFU | SM clock, median | Power, mean (limit) | Hours for 1.76B tokens |
|---|---|---|---|---|---|---|---|---|
| FP32, eager | 4 × 128 | 5,783 | 90.7 s | 7.17 GiB | 14.2% | 1,755 MHz | 49.6 W (45.7-50.0) | 84.6 |
| + TF32 matmuls | 4 × 128 | 8,545 | 61.4 s | 7.17 GiB | 21.0% | 1,845 MHz | 49.3 W (45.8-50.0) | 57.3 |
| + BF16 autocast | 4 × 128 | 19,808 | 26.5 s | 4.66 GiB | 48.8% | 1,980 MHz | 48.4 W (46.9-50.0) | 24.7 |
Eager mode is PyTorch’s default: every operation runs as its own GPU kernel as soon as Python reaches it. Four sequences is the largest power-of-two micro-batch that fits in eager FP32: 7.17 GiB of the card’s 8.
TF32: same storage, faster multiplies
TF32 (TensorFloat-32) is a tensor-core mode, not a storage format. The inputs stay FP32 in memory, the tensor cores round them to 10 mantissa bits while multiplying, and the sums stay in FP32. PyTorch leaves it off for matmuls by default; torch.set_float32_matmul_precision’s default “highest” keeps “24 mantissa bits,” and "high" allows TF32. Turning it on made steps 1.48 times faster.
On this GPU that gain needs explaining. The Ada whitepaper gives the RTX 4090 82.6 TFLOPS for both FP32 on the CUDA cores and dense TF32 on the tensor cores: equal peaks, 14.6 TFLOPS each when scaled to 24 SMs at boost. The difference is how close the kernels get. In a profile of one FP32 micro-batch, the matmuls ran as ampere_sgemm kernels and took 436 ms for 2.55 trillion FLOPs, 5.9 TFLOPS, under half of the 12.7 TFLOPS FP32 roof GPU Part 4 measured. With TF32 on, cuBLAS switched to CUTLASS tensor-op kernels and the same matmuls took 256 ms, 10.0 TFLOPS. The kernels that weren’t matmuls took 280 and 228 ms, so the whole micro-batch gained 1.48 times, not the matmuls’ 1.70.
BF16: half the bytes, twice the rate
torch.autocast(device_type="cuda", dtype=torch.bfloat16) runs each matmul in BF16, the 16-bit format with FP32’s exponent range, while the weights, gradients and optimizer state stay FP32 (Math Part 14 explains why that split works). Steps got another 2.32 times faster, for three reasons:
- BF16 tensor cores run at twice the TF32 rate: the weight matmuls reached 23.4 TFLOPS, and matmul time per micro-batch fell from 256 to 93 ms (the 256 includes attention’s score matmuls).
- Activations, the intermediate results saved for the backward pass, take half the bytes, so memory-bound kernels move half the data. Peak memory fell from 7.17 to 4.66 GiB.
- Attention changed algorithm. In FP32,
scaled_dot_product_attentionwith grouped-query heads fell back to its “math” implementation, which builds the full 1,024 × 1,024 score matrix per head: PyTorch’s SDPA documentation says GQA “currently works only for Flash_attention and math kernel,” and the FlashAttention kernel needs 16-bit inputs. Under BF16 it picks FlashAttention.
The loss after these steps agreed to the third decimal (9.1774, 9.1770, 9.1780), so the lower precision didn’t change what these steps learned.
Step 2: the attention kernel
Attention is one call in model.py, and PyTorch chooses what runs it. The torch.nn.attention.sdpa_kernel context manager pins a backend; a few lines swap in textbook attention instead:
_masks = {}


def naive_forward(self, x, cos, sin):
    """Textbook attention: full T x T scores, a boolean causal mask, softmax in FP32."""
    B, T_, _ = x.shape
    q, k, v = _qkv(self, x, cos, sin)          # model.py's projections and RoPE, unchanged
    g = self.n_head // self.n_kv_head
    k, v = k.repeat_interleave(g, dim=1), v.repeat_interleave(g, dim=1)
    if (T_, x.device) not in _masks:
        _masks[(T_, x.device)] = torch.ones(T_, T_, dtype=torch.bool, device=x.device).triu(1)
    s = (q @ k.transpose(-2, -1)) * self.hd ** -0.5
    s = s.masked_fill(_masks[(T_, x.device)], float("-inf"))
    p = torch.softmax(s.float(), dim=-1).to(q.dtype)
    return self.wo((p @ v).transpose(1, 2).reshape(B, T_, -1))


M.Attention.forward = naive_forward           # M is model.py; patched in the benchmark's process only
The memory-efficient backend refuses enable_gqa=True (“No available kernel”), so for it the benchmark copies each key and value head to its three query heads first. Textbook attention at 4 sequences needed 8.0 GiB reserved in eager mode, right at the card’s edge, so the eager comparison uses 2 sequences per micro-batch:
| Attention | Eager, micro-batch 2: tokens/s | Peak memory | Compiled, micro-batch 4: tokens/s | Peak memory |
|---|---|---|---|---|
| SDPA default (picked FlashAttention) | 19,315 | 3.09 GiB | 29,021 | 2.87 GiB |
| SDPA, FlashAttention-2 forced | 19,266 | 3.09 GiB | 29,036 | 2.87 GiB |
| SDPA, cuDNN | 19,337 | 3.09 GiB | 28,670 | 2.87 GiB |
| SDPA, memory-efficient (K, V copied) | 18,977 | 3.10 GiB | 27,870 | 2.88 GiB |
| SDPA, math | 10,030 | 4.14 GiB | 19,391 | 4.72 GiB |
| Textbook, masked softmax | 9,945 | 4.50 GiB | 21,890 | 4.76 GiB |
The three fused kernels are within 4% of each other. All three compute attention in tiles that stay in on-chip memory and never write the score matrix to the GPU’s main memory (the cuDNN kernels are named cudnn_generated_fort_native_sdpa_sm80_flash_fprop, a FlashAttention variant too). The math backend and textbook attention write every score, mask it, softmax it and read it back. They cost a quarter to a half of the speed and add 1 to 2 GiB.
Compiled, the textbook version beat the math backend by 13%: Inductor merged the scale, mask and softmax into one kernel, triton_per_fused__softmax__to_copy_exp_masked_fill_mul_prepare_softmax_online_sub_view, which still writes and reads the full score matrix. The default needs no help: PyTorch 2.11 picked FlashAttention by itself, so model.py’s one line is right. Watch only for a silent fallback like FP32’s, which a profile shows by kernel name: pytorch_flash::flash_fwd_kernel is the fast path, softmax_warp_forward the math backend. In the final configuration FlashAttention takes 10.7% of the GPU time.
Step 3: torch.compile
torch.compile traces the model into a graph, and its Inductor backend writes fused Triton kernels for everything between the matrix multiplies, which stay with cuBLAS (GPU Part 9 reads the generated code). At the same 4 sequences per micro-batch:
| Configuration | Tokens/s | Step time | Peak memory | MFU | SM clock, median |
|---|---|---|---|---|---|
| BF16, eager | 19,808 | 26.5 s | 4.66 GiB | 48.8% | 1,980 MHz |
BF16, torch.compile | 29,021 | 18.1 s | 2.87 GiB | 71.5% | 1,980 MHz |
Same clock, 1.47 times the speed and 38% less memory. A torch.profiler trace of two micro-batches and one optimizer step shows where it came from:
| Kernel group | Eager: kernels | Eager: GPU time | Compiled: kernels | Compiled: GPU time |
|---|---|---|---|---|
| Matrix multiplies (cuBLAS) | 426 | 185.2 ms | 426 | 176.4 ms |
| Attention (FlashAttention fwd + bwd) | 80 | 27.6 ms | 80 | 26.8 ms |
| Elementwise and norms | 2,880 | 156.2 ms | 792 | 52.7 ms |
| Loss (log-softmax, NLL) | 8 | 26.7 ms | 8 | 8.5 ms |
| Optimizer (clip + AdamW, foreach) | 57 | 39.8 ms | 57 | 39.7 ms |
| Copies and memsets | 190 | 4.8 ms | 86 | 0.09 ms |
| Total | 3,641 | 440.3 ms | 1,449 | 304.1 ms |
The matmuls and attention didn’t change; they were already single library calls. The elementwise group, RMSNorm, RoPE, the SwiGLU gate, the residual adds and the FP32-to-BF16 casts, shrank from 2,880 kernels to 792 and from 156 to 53 ms. In eager mode each of those is several kernels, each reading its input from memory and writing its output back. The compiled kernels are named after what they merged. triton_poi_fused__unsafe_view_mul_silu_silu_backward_view is SwiGLU’s backward in one pass. triton_per_fused__to_copy__unsafe_view_add_mean_mul_pow_rsqrt is a residual add plus a whole RMSNorm. And triton_red_fused__log_softmax__log_softmax_backward_data__..._nll_loss_backward_nll_loss_forward is the loss and its gradient over each micro-batch’s 134 million logits; the loss group fell from 26.7 to 8.5 ms.
The memory fell for the same reason: a fused kernel’s intermediates never exist as tensors, so they can’t be saved for the backward pass. That’s what lets the micro-batch grow from 4 to 16.
Graph breaks and compile time
torch._dynamo.explain reports one graph of 427 operations and no graph breaks, the places where tracing stops and Python takes over (GPU Part 9 shows their causes). The cost is the first call: 19 to 23 s with an empty cache, compiling the forward and backward graphs, and 2.5 s in a new process with Inductor’s on-disk cache warm. Over a 17-hour run that’s nothing. The validation pass in train.py runs the model under torch.no_grad(), which fails a guard (“GLOBAL_STATE changed: grad_mode”) and compiles a second, forward-only graph: 10.1 s the first time, nothing after.
The four modes
PyTorch 2.11’s torch.compile documentation lists four modes. "reduce-overhead" “reduces the overhead of python with CUDA graphs,” replaying a recorded sequence of kernels with one launch, and "max-autotune" “leverages Triton or template based matrix multiplications” and adds CUDA graphs. At the final settings (16 sequences, fused AdamW):
| Mode | First micro-batch (cold compile) | Tokens/s | Tokens/s per GHz |
|---|---|---|---|
| default | 19 to 23 s | 29,840 | 15,542 |
| reduce-overhead | 20 s | 30,059 | 15,534 |
| max-autotune-no-cudagraphs | 99 s | 30,267 | 15,458 |
| max-autotune | 116 s | 30,200 | 15,551 |
None is faster. CUDA graphs remove launch overhead, and a 540 ms micro-batch has almost none: the GPU sat idle 0.5% of the time. Every max-autotune compile logged “Not enough SMs to use max_autotune_gemm mode”: Inductor only tries Triton matmul templates on GPUs with at least 68 SMs (GPU Part 9 found the check in its source), so on this one it spent an extra 80 to 95 seconds compiling and tuning everything except the matmuls, which are two thirds of the time.
CUDA graphs also set a trap. With gradient accumulation, both graph modes crashed within a few micro-batches: “accessing tensor output of CUDAGraphs that has been overwritten by a subsequent run.” Calling torch.compiler.cudagraph_mark_step_begin() before each call, as the message suggests, wasn’t enough. Allocating every gradient up front as an ordinary tensor and zeroing it in place (zero_grad(set_to_none=False)) fixed it, which suggests a fresh gradient was being handed memory from the graph’s own pool. The default mode needs none of this.
Step 4: batch size, the optimizer, accumulation and the data
Micro-batch size
With compilation on, memory stops being the limit at 4 sequences. Every row below is still a full 524,288-token step; only the split changes:
| Micro-batch × steps accumulated | Tokens/s | Peak memory | MFU |
|---|---|---|---|
| 1 × 512 | 22,824 | 1.90 GiB | 56.2% |
| 2 × 256 | 27,099 | 2.22 GiB | 66.7% |
| 4 × 128 | 29,000 | 2.87 GiB | 71.4% |
| 8 × 64 | 29,490 | 4.16 GiB | 72.6% |
| 16 × 32 | 29,840 | 6.75 GiB | 73.5% |
Memory grows by 0.33 GiB per sequence on top of about 1.6 GiB of fixed state, as Part 1 found. Speed climbs to 4 sequences, then flattens: 4,096 tokens already give every matrix multiply thousands of rows, and the fixed cost per micro-batch, about 700 kernel launches, is spread thinner. From 4 to 16 the gain is 3%, or 4.5% once the slightly lower clock is allowed for. Sixteen costs nothing, so it’s the default. At 32 the step would need about 12 GiB, and Part 1 saw what WSL2 does then: no error, a spill into system memory and a 10-fold slowdown.
The optimizer step
PyTorch’s AdamW has three implementations: a for-loop over the 92 parameter tensors, “foreach” (the default on CUDA), which batches the arithmetic across tensors, and fused, one pass for the whole update. The AdamW documentation calls fused “theoretically fastest with both vertical and horizontal fusion,” and says it isn’t the default because “the fused implementation is relatively new.” GPU time of the whole update, gradient clipping included, measured with CUDA events:
| AdamW implementation | Update time | Share of a 17.5 s step |
|---|---|---|
| for-loop | 33.1 ms | 0.19% |
| foreach (default) | 39.9 ms | 0.23% |
fused (fused=True) | 17.5 ms | 0.10% |
Fused is twice as fast as the default, and it doesn’t matter here. An update streams about 2.5 GB of FP32 weights, gradients and moments through memory, tens of milliseconds at most, once per 32 micro-batches. (Foreach was even slower than the loop, probably because it makes several passes over the whole state.) Use fused=True, but don’t expect to see it in tokens per second.
Gradient accumulation
Accumulating costs one addition per parameter per micro-batch, since every backward pass after the first adds into the gradients: 92 add kernels, 5.0 ms, about 1% of a 540 ms micro-batch. Fewer, bigger optimizer steps trade that against the update itself:
| Tokens per optimizer step | Micro-batches per step | Tokens/s (range) | Update share |
|---|---|---|---|
| 16,384 | 1 | 29,808 (28,400-30,231) | 3.1% |
| 65,536 | 4 | 30,296 (29,484-30,466) | 0.8% |
| 524,288 | 32 | 29,840 (29,417-30,047) | 0.1% |
The differences are within the noise, so the batch size can be chosen for the optimization (Part 5’s job), not for speed.
The data loader and host-to-device copies
Part 3’s ShardLoader slices a memory-mapped token file: 12 µs on the CPU for a 16 × 1,024 micro-batch, and 256 KB of input and target IDs to copy. The copy can still stall things. A plain .cuda() from ordinary (“pageable”) memory waits for the GPU; PyTorch’s pinned-memory tutorial says that with non_blocking=False “a cudaStreamSynchronize will be called after each and every cudaMemcpyAsync.” The CPU idles until the previous backward pass ends, and only then queues the next forward pass. Pinned (page-locked) memory plus non_blocking=True lets the copy queue like any other GPU work.
| Host-to-device copy | CPU time blocked per step | GPU idle per 2 micro-batches | Tokens/s | Tokens/s per GHz of SM clock |
|---|---|---|---|---|
| Pageable, blocking (default) | 17.1 s | 5.3 ms | 28,895 | 15,535 |
Pageable, non_blocking=True | 2.9 s | 4.3 ms | 29,975 | 15,491 |
Pinned, non_blocking=True | 0.012 s | 5.1 ms | 29,840 | 15,542 |
The CPU stops waiting, but the GPU doesn’t notice: it sat idle about 5 ms out of 1,080 in every case, because the compiled model queues its kernels faster than they run. The tutorial also warns that tensor.pin_memory().to(device, non_blocking=True) “can be up to twice as slow” as a plain transfer, since pinning is itself a copy; for these two tensors it took 13 µs. This setup needs no DataLoader worker processes.
Clock drift as noise
The last two ladder steps went the wrong way: adding fused AdamW lowered throughput from 30,078 to 28,895 tokens per second, and pinned copies to 28,430. Neither change can do that. The power limit slid from 50 W to as low as 40.8 W, and the median SM clock fell from 1,935 to 1,845 MHz. Divide tokens per second by the median clock and all twelve compiled micro-batch-16 runs land between 15,400 and 15,550 tokens per second per GHz, within 1% of each other. Changes worth less than about 3% are invisible in end-to-end throughput here; measure them with CUDA events or a profiler.
Step 5: where the time goes now
With every useful setting on, a profile of two 16-sequence micro-batches and one fused AdamW update, scaled to a full 32-micro-batch step:
| Kernel group | GPU time per step | Share | What’s in it |
|---|---|---|---|
| Matrix multiplies (cuBLAS) | 11.64 s | 68.4% | 71 weight matmuls per micro-batch forward, two each backward |
| Elementwise and norms (Triton) | 2.92 s | 17.1% | RMSNorm, SwiGLU, RoPE, BF16 weight casts, layout copies, gradient sums |
| Attention (FlashAttention-2) | 1.82 s | 10.7% | forward 0.42 s; backward 1.41 s, including two small helper kernels |
| Loss (fused log-softmax and NLL) | 0.55 s | 3.2% | 537 million logits per micro-batch, forward and backward |
| Optimizer (fused AdamW, clipping) | 0.02 s | 0.1% | once per step |
| GPU idle | about 0.08 s | 0.5% | gaps between kernels |
The matmuls are close to done: 6N FLOPs per token, 8.66 trillion per micro-batch, in 364 ms, which is 23.8 TFLOPS, 94% of the 25.3 TFLOPS roof (the SM clock ran at 1,875 to 2,175 MHz in this window). FlashAttention reaches 13.6 TFLOPS, counting only the half of the score matrix the causal mask leaves; GPU Part 10 measured PyTorch’s FlashAttention-2 forward at 66% of the clock’s peak at 1,024 tokens, with fewer tiles to keep 24 SMs evenly busy than at longer contexts. The other fifth is memory-bound elementwise work, already fused.
That gives three ceilings:
- If every FLOP ran at the measured roof: 40,613 tokens per second, MFU 100% by definition.
- If everything but matmuls and attention cost nothing: 16,384 tokens in 421 ms, about 38,900 tokens per second, 30% above today.
- Realistically, less. The remaining elementwise kernels already touch their tensors once; removing them means folding RMSNorm and SwiGLU into the matmuls, as hand-written training code like llm.c does, and Inductor won’t generate matmuls on 24 SMs.
So the settings Part 7’s run should use, and Part 5’s train.py flags that set them:
| Setting | Value | In train.py | Measured effect here |
|---|---|---|---|
| Precision | BF16 autocast, FP32 weights and optimizer | --dtype bf16 (default) | 2.3× over TF32 |
| TF32 for leftover FP32 matmuls | on | always on | 1.48× in an FP32 run; nothing left to speed up under BF16 |
| Compilation | torch.compile, default mode | --compile | 1.47× and 38% less memory |
| Attention | SDPA default (FlashAttention-2) | model.py as written | 1.3× to 1.9× over math or textbook attention |
| Micro-batch × accumulation | 16 × 32 = 524,288 tokens | --micro-batch 16 --accum 32 (defaults) | 3% to 4.5% over 4 sequences |
| Optimizer | AdamW, fused=True | --fused | 22 ms less per step than foreach, 0.13% |
| Host copies | pinned, non_blocking=True | always on | within noise |
--compile and --fused should be on by default for the main model.
The prediction for Part 7
Benchmarks run three steps; Part 7 runs 3,360. As a last check, Part 5’s train.py ran the 88M model with --compile --fused and its defaults for 32 optimizer steps (9.5 minutes), with learning-rate warm-up, clipping and logging. Leaving out the first step, it averaged 29,408 tokens per second (28,823 to 29,922 per step), MFU 72.4%, with a median SM clock of 1,890 MHz, power averaging 49.3 W against a limit that moved between 42.9 and 50 W, and the GPU at 75 to 83 °C. Peak memory was 6.75 GiB, and the loss fell from 10.59 to 7.54.
Part 7’s run is 3,360 steps of 524,288 tokens, 1,761,607,680 tokens:
1,761,607,680 tokens / 29,408 tokens/s = 59,902 s = 16.6 hours of training steps
1,761,607,680 tokens / 28,296 tokens/s = 62,256 s = 17.3 hours (Part 1's 10-minute sustained rate)
The two lines differ only in how generous the laptop’s power limit was that day. Validation passes and checkpoints come on top, so Part 7 should plan for about 17 to 18 hours.
In the real world
The same settings, and the same yardstick, at larger scale:
| Run | Hardware | Throughput | MFU | Source |
|---|---|---|---|---|
| This series, 88M model | 1 RTX 4060 Laptop | about 30,000 tokens/s | 74% (of measured 25.3 TFLOPS) | This article |
| llm.c, GPT-2 124M | 1 A100 40GB PCIe | 177,968 tokens/s | 49% | llm.c discussion #481 |
| FlashAttention-2, GPT-style models | A100 | up to 225 TFLOPS per GPU | 72% | Dao, 2023 |
| PaLM 540B | 6,144 TPU v4 chips | 238,300 tokens/s | 46.2% | Chowdhery et al., 2022 |
| Llama 3 405B | 8,192 to 16,384 H100s | 380 to 430 TFLOPS per GPU | 38% to 43% | Llama 3 paper, Table 4 |
- nanoGPT’s README reports
torch.compilecutting a GPT-2 124M iteration “from ~250ms / iter to 135ms / iter,” 1.85 times. - The big runs sit lower for reasons a single GPU never meets: thousands of GPUs exchange gradients and wait on each other, and Llama 3’s paper attributes its drop from 43% to 41% to a smaller batch per data-parallel group. PaLM recomputed some activations instead of storing them, so its hardware ran 57.8% busy while 46.2% counted as model FLOPs.
- Data center MFU divides by the spec sheet. Against its spec-sheet 29.1 TFLOPS, this laptop’s best is 64%, close to llm.c’s “quite efficient at up to ~60% model flops utilization.”
Common misconceptions
- “Fused optimizers make training faster.” Fused AdamW halved the update’s GPU time, and the step didn’t get measurably faster: the update is 0.1% of a step that accumulates 32 micro-batches. It matters when updates are frequent or the model is tiny.
- “TF32 doubles FP32 matmul speed.” On Ada consumer chips the TF32 tensor-core peak equals the FP32 CUDA-core peak. The 1.48 times here came from cuBLAS’s FP32 kernels reaching under half their peak. BF16 is what changes the arithmetic rate.
- “The attention kernel is the big lever for a small model.” The three fused SDPA backends are within 4% of each other, and attention is 11% of the step. The lever is avoiding the slow paths: textbook attention, or a silent fallback to the math backend, as FP32 inputs with grouped-query heads trigger.
- “Bigger micro-batches are always faster.” From 4 to 16 sequences gained 3% to 4.5%; at 32 the card spills into system memory and runs 10 times slower, without an error.
- “MFU is a fixed property of a training run.” The same 30,000 tokens per second is 74% of the measured peak and 64% of the spec sheet’s, and power-limit drift moved throughput 5% between back-to-back runs. Compare MFU only at the same peak and, on a laptop, the same clock.
Key takeaways
- TF32, BF16 autocast,
torch.compileand a 16-sequence micro-batch take the 88M model from 5,783 to about 30,000 tokens per second, 74% of the measured peak, and Part 7’s run from 85 hours to about 17. - BF16 is the biggest step, 2.3 times: double the tensor-core rate, half the activation memory, and FlashAttention.
torch.compileadds 1.47 times by fusing 2,880 small kernels into 792, and its memory savings let 16 sequences fit.- Fused AdamW, pinned memory, CUDA graphs and accumulation each change a step by less than the laptop’s clock drift.
- Two thirds of what’s left is matrix multiplies at 94% of the roof; the software ceiling is about 39,000 tokens per second.
What’s next
Part 7 runs it: the 88M model on 1.76 billion tokens with these settings, about 17 hours on the laptop, checkpointed so a crash costs minutes. It reads the loss curves that come out, the spikes, the held-out loss, and samples of the model’s writing as it learns.
Further reading
- PaLM: Scaling Language Modeling with Pathways (Chowdhery et al., 2022): Section 4 and Appendix B define MFU and the
6N + 12LHQTFLOP count used here. - FlashAttention-2: Faster Attention with Better Parallelism and Work Partitioning (Dao, 2023): the attention kernel SDPA picks on this GPU, and its training-throughput numbers on A100s.
- The Llama 3 Herd of Models (Llama Team, 2024): Table 4 gives BF16 MFU at 8,192 to 16,384 H100s.
- NVIDIA Ada GPU architecture whitepaper: the FP32, TF32 and BF16 peak rates behind the spec-sheet numbers.
- PyTorch
torch.compiledocumentation: the four modes and what each turns on. - PyTorch
scaled_dot_product_attentiondocumentation: the backends,sdpa_kernel, and which ones support grouped-query attention. - PyTorch
AdamWdocumentation: the for-loop, foreach and fused implementations. - A guide on good usage of
non_blockingandpin_memory()in PyTorch: when host-to-device copies synchronize, and when pinning helps. - Reproducing GPT-2 (124M) in llm.c in 90 minutes for $20 (Karpathy, 2024): a hand-written training loop in C and CUDA, with its MFU on one and eight A100s.
- nanoGPT (Karpathy): the PyTorch training script whose README reports the
torch.compilespeed-up quoted above.