
Measuring LLMs: Evals and Benchmarks · Part 1 of 11
Why Measuring LLMs Is Hard: Validity, Saturation and Goodhart
What a benchmark score claims and what it can't: validity, reliability, saturation and Goodhart's law, with measured probes on ARC, MMLU and MMLU-Pro.
On this page
TL;DR
A benchmark score is a small, fixed sample of behavior that people read as a broad claim about ability. This article explains the gap: validity (is the score about the right thing?), reliability (would it come out the same again?), saturation, and Goodhart’s law. Measured here: Claude Haiku 5.5 and Sonnet 5.5 tie at 200 of 200 on ARC-Easy but sit 22.5 points apart on MMLU-Pro. With the question hidden, Haiku still gets 47.7% of an MMLU sample right (chance is 25%), and swapping the right option’s text for “None of the other options” costs it 32.5 points. It ends with a map of the ten parts that follow.
Why it matters
Hide the question, keep only the four answer options, and Claude Haiku 5.5 still gets 47.7% of a standard MMLU sample right. Guessing would get 25%.
That is one of three measurements in this article, and all three say more about the test than about the model. On ARC-Easy, a grade-school science benchmark, Haiku and its bigger sibling Sonnet 5.5 both answered all 200 questions in a shared sample correctly, so the benchmark can’t tell them apart. On MMLU-Pro, the same two models were 22.5 points apart. And when the text of the right answer was replaced with “None of the other options”, Haiku’s score fell from 85.3% to 52.7%, though the right answer was still on the list.
Benchmark numbers decide which model a company buys and which lab claims the lead. The System Design guide to building an eval suite builds tests from a product’s real failures; this series goes underneath, to what any score can and can’t tell you. This part names the problems, and the ten after it measure each one.
The intuition
Think of a driving test. The examiner watches you for twenty minutes: a few turns, one parallel park, an emergency stop. Then they write down “pass”, and everyone reads that as “this person can drive safely”. The test is a small, fixed sample of driving, and the claim reaches far beyond it.
Four things can go wrong with that leap. The test might check the wrong skill: perfect mirror checks, no motorway. It might cover too little: never rain, never night. It might not predict real life: passing drivers could crash as often as failing ones. And it might be noisy: the same driver passes on Monday and fails on Friday.
Two more things happen over time. Once almost everyone passes, a pass stops telling you who drives better. And once driving schools learn the examiners’ streets, they teach those streets. Both happen to LLM benchmarks, only faster.
The analogy breaks in two places. A learner can’t read the examiner’s route sheet, but a model can be trained on text that contains the test questions (Part 5). And no examiner can test a driver ten thousand times for a few cents, which you can do with a model, so its noise can be measured instead of guessed.
Step 1: what a benchmark score claims
A benchmark is a fixed set of test items (questions or tasks), a way of presenting each one to the model, and a rule for scoring the answer. Its output is usually one number, such as “81.2% on MMLU”. MMLU (Massive Multitask Language Understanding, Hendrycks et al., 2020) is the classic example: about 14,000 four-option multiple-choice test questions over 57 subjects, from elementary mathematics to law.
That number rests on a chain of inferences, and each link can break:
- The model chose these letters on these items, with this prompt. (This is all that was observed.)
- So it would score about the same on other items like these. (Sampling: a different draw of questions.)
- So it has the ability the items were written to test, say “college-level knowledge”. (Meaning.)
- So it will do well on the real task you care about. (Transfer.)
Psychologists, who measure invisible traits like intelligence and anxiety, call the soundness of this chain validity and split it into kinds that map well onto LLM benchmarks:
| Kind of check | The question it asks | What it looks like for an LLM benchmark |
|---|---|---|
| Construct validity | Does the score track the ability it is named after? | Does picking the right letter on MMLU mean the model knows the subject, or that it spots which option looks like an answer? |
| Content validity | Do the items cover that ability, in sensible proportions? | 57 subjects, but none of them are “write a contract” or “debug this service” |
| External (criterion) validity | Does the score predict performance somewhere else? | Do models that rank higher on MMLU also help users more? |
| Ecological validity | Does the test look like real use? | Real users rarely hand over four options, one of them guaranteed right |
| Reliability | Would you get the same score again? | Rerun with new samples, other items or another prompt wording |
Reliability is about precision: how much the number would move if you measured again. Validity is about accuracy: whether the number is about the right thing at all. A bathroom scale that always reads 3 kg light is reliable and not valid. Part 3 of this series is about reliability, as was Agentic AI Part 11 for agents; most of this part is about validity.
Construct validity is what a benchmark’s name promises. Raji et al. (2021) open with a Sesame Street book in which Grover tours a museum of “everything in the whole wide world”, room by room (“The Carrot Room”, “The Tall Hall”), until a door marked “Everything Else” leads outside. Benchmarks sold as measures of general “language understanding”, they argue, are as finite as that museum and “cannot possibly capture anything representative of the claims to general applicability being made about them”.
A 2025 review by Bean et al. had 29 expert reviewers code 445 LLM benchmark papers. Of those that defined what they measured, 47.8% used a contested definition. Only 53.4% gave any evidence for construct validity, and only 16.0% used uncertainty estimates or statistical tests when comparing results.
Step 2: saturation and the benchmark lifecycle
A benchmark is saturated when the best models score so close to its ceiling that the gaps between them are smaller than the noise. The ceiling is often below 100%, because some answer keys are wrong. Saturation is what success looks like, and it means the benchmark can no longer rank the models at the top.

The cycle has sped up. Introducing Dynabench, Kiela et al. (2021) wrote that “it used to take decades for machine learning models to surpass estimates of human performance on benchmark tasks”, a milestone “now routinely reached within just a few years for newer datasets”. GLUE, a 2018 suite of language-understanding tasks, “saturated within a year”, and its successor SuperGLUE already had models above the human baseline. Their fix is dynamic benchmarking: people keep writing items that fool the current best model, so the test moves with the models.
Ott et al. (2022) mapped 3,765 benchmarks in computer vision and language processing. Of the 1,079 state-of-the-art curves with at least five results spread over a year or more, 378 (35%) fell in a “saturation/stagnation” cluster, where “values close to the ceiling of all results are observed very soon in the time series and limited remaining growth in performance is recorded afterwards”. And the 2025 AI Index from Stanford HAI (read 2026-11-04) reported that three benchmarks introduced in 2023 as hard, MMMU, GPQA and SWE-bench, saw scores rise “by 18.8, 48.9, and 67.3 percentage points” within a year.
The same two models on an easy test and a hard one
To watch saturation happen, give two models the same questions from four multiple-choice sets of rising difficulty:
| Item set | What it is | Items used | Options | License |
|---|---|---|---|---|
| ARC-Easy | Grade-school science questions (AI2 Reasoning Challenge, Clark et al., 2018) | all 2,376 test items | mostly 4 | CC BY-SA 4.0 |
| ARC-Challenge | The same pool, keeping only questions “answered incorrectly by both a retrieval-based algorithm and a word co-occurence algorithm” | all 1,172 test items | mostly 4 | CC BY-SA 4.0 |
| MMLU | 57 subjects, high school to professional level | 1,140 test items, 20 per subject (seed 0) | 4 | MIT |
| MMLU-Pro | A harder 2024 rebuild of MMLU (Wang et al.), with more reasoning items and more distractors | 840 test items, 60 per category (seed 0) | mostly 10 | MIT |
The models are Claude Haiku 5.5 and Claude Sonnet 5.5, called through the Anthropic Message Batches API: zero-shot, thinking off, default sampling, one reply per item. The system prompt says “Your entire reply must be one letter, the letter of your answer, with no explanation.” A small module, validity.py, builds each prompt from an item (run from the folder that holds lab/ and data/):
from lab.validity import load, request

item = load("data/mmlu-1140.json")[382]
for kind in ("choices_only", "nota_correct"):
    p = request(item, kind)
    print(f"--- {kind}\n{p['system']}\n\n{p['messages'][0]['content']}\n")
--- choices_only
You are taking a multiple-choice test, but the question has been hidden: you only see the answer options. Guess which option is most likely the correct answer. Your entire reply must be one letter, the letter of your guess, with no explanation.
Options:
A. 25% of the isotope is left
B. 25% of the isotope decayed
C. 12.5% of the isotope is left
D. 12.5% of the isotope decayed
Answer:
--- nota_correct
You are taking a multiple-choice test. Your entire reply must be one letter, the letter of your answer, with no explanation.
Question: Three half-lives after an isotope is prepared,
A. 25% of the isotope is left
B. 25% of the isotope decayed
C. None of the other options
D. 12.5% of the isotope decayed
Answer:Those two kinds are the probes in Step 3; the full kind used here has the question and all four original options. Replies were capped at 8 tokens. On calculation items the models often ignored the one-letter rule and started working, so a reply cut off before naming a letter was asked again with room to finish (1,024 tokens for Haiku, 768 for Sonnet) and scored by its final letter: 25% of MMLU-Pro items for Haiku, 24% for Sonnet, 7% of MMLU items for Haiku. Haiku answered every item; Sonnet, at 20 times the price per token, answered the same random 200 items (seed 0) from three sets. Every API run in this article, 12,074 batch requests including the probes in Step 3, cost $0.35 in total: $0.13 for Haiku and $0.22 for Sonnet.
| Item set | Haiku, all items | Haiku, the 200 | Sonnet, the same 200 | Sonnet minus Haiku, paired |
|---|---|---|---|---|
| ARC-Easy | 98.2% (97.6 to 98.7), n = 2,376 | 200 of 200 | 200 of 200 | none measurable |
| ARC-Challenge | 93.0% (91.4 to 94.3), n = 1,172 | not run | not run | |
| MMLU | 85.3% (83.1 to 87.2), n = 1,140 | 84.5% | 92.5% | +8.0 points (+3.0 to +13.0) |
| MMLU-Pro | 71.0% (67.8 to 73.9), n = 840 | 65.5% | 88.0% | +22.5 points (+16.0 to +29.0) |
Ranges in brackets are 95% confidence intervals: Wilson intervals for single rates, and for differences a paired bootstrap, which resamples the 200 shared items 10,000 times. Part 3 explains both.
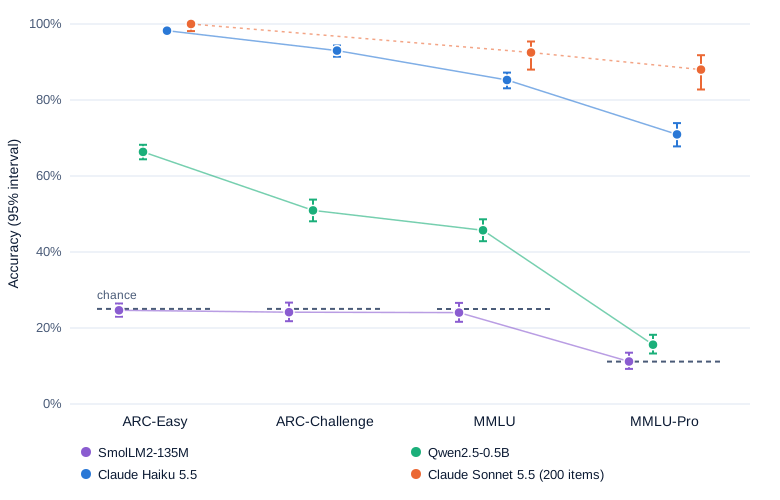
On ARC-Easy the two models are indistinguishable: 200 out of 200 is consistent with any true accuracy from 98.1% to 100%, and across all 2,376 items Haiku leaves only 1.8 points of headroom for anyone to beat it by. With the same two models, Sonnet leads by 8 points on MMLU and by 22.5 on MMLU-Pro, with an interval far from zero.
Part of that last 1.8 points isn’t the model’s fault. Among Haiku’s 42 misses is “What renewable energy source used to make electricity is thought to be always available?”, keyed “wind” against oil, coal and nuclear; Haiku’s first reply began “I’m not sure this is”. Another keys the tilt of Earth’s axis as the cause of “equatorial deserts”. Near a ceiling set by flawed items, the last points measure agreement with the answer key more than ability (Part 2 counts these errors).
Saturation has a mirror image at the bottom of the scale. Two small open models, SmolLM2-135M and Qwen2.5-0.5B (both Apache 2.0), ran the same items with the same prompt text on an NVIDIA GeForce RTX 4060 Laptop GPU (8 GB), in bf16 with Transformers 5.21.1 and PyTorch 2.11 (3.2 minutes in all). Each answer is the option letter with the highest probability as the next token after “Answer:”. Qwen2.5-0.5B scored 66.3% on ARC-Easy (64.4 to 68.2) against SmolLM2-135M’s 24.7%, a gap of 42 points. On MMLU-Pro they scored 15.6% and 11.2%, both close to the 11.2% chance rate. The easy benchmark that can’t separate Haiku from Sonnet separates the small models easily, and the hard one that separates the Claude models barely registers the small ones.
Swipe to pan the diagram, or tap it to zoom.
Every benchmark has a useful band. Below it, scores sit on the chance floor; above it, they pile up at the ceiling. Inside it, gaps between models are wider than the error bars. For SmolLM2-135M even ARC-Easy is out of range in this letter format, though From Scratch Part 9 scored the same model at 64.4% on ARC-Easy by comparing the probability of each full answer text.
The harness mattered as much as the model. Scored strictly, counting a reply that was cut off at 8 tokens as wrong, Haiku’s MMLU-Pro score would have been 50.1% instead of 71.0%, and Sonnet’s 65.5% instead of 88.0%. A 21-point swing from one setting is a reliability problem in the measurement itself, and Part 4 is devoted to it.
Step 3: what the score is actually measuring
Construct validity asks a harder question than saturation: even when scores differ, what are they differences in? You can’t open a model and check, but you can change the test in ways that should, or shouldn’t, change the score. Here are two such probes, run on Claude Haiku 5.5 with the settings above.
Probe 1: hide the question
If a multiple-choice score measures knowledge of what the question asks, a model shown only the options should score at chance. Balepur et al. (2024) tried this choices-only prompt on four open models (LLaMA-2 70B, Falcon 40B, Mixtral 8x7B and Phi-2) and three benchmarks (ARC, MMLU and HellaSwag). It beat the majority baseline, always answering the most common letter, “in 11/12 cases, with up to 0.33 accuracy gain”.
Here the system prompt tells Haiku that the question has been hidden and asks for its best guess; the user turn holds only the lettered options. One reply per item:
| Item set | Items | Chance | Most common letter | Options only | Question and options |
|---|---|---|---|---|---|
| ARC-Challenge | 1,172 | 25.0% | 26.5% | 47.3% (44.4 to 50.1) | 93.0% (91.4 to 94.3) |
| MMLU subset | 1,140 | 25.0% | 26.8% | 47.7% (44.8 to 50.6) | 85.3% (83.1 to 87.2) |
| MMLU-Pro subset | 840 | 11.2% | 12.7% | 35.5% (32.3 to 38.8) | 71.0% (67.8 to 73.9) |
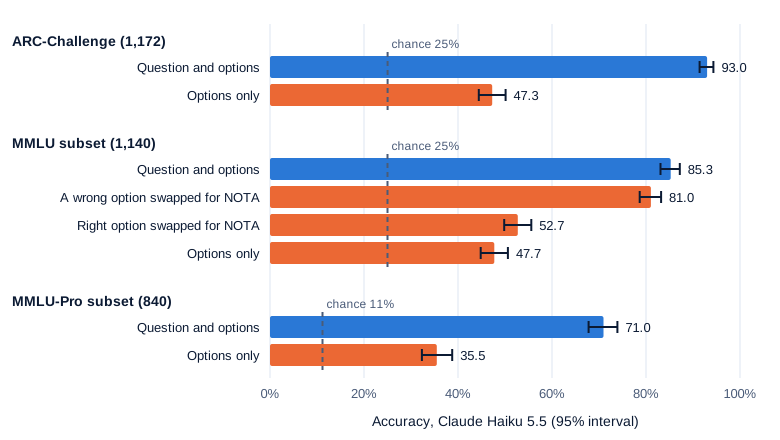
Without the question, Haiku gets nearly half of ARC-Challenge and MMLU right, 22 to 23 points above chance, and on MMLU-Pro, where most items have ten options, it scores three times chance. Of the 972 MMLU items it answered correctly with the question, it also got 491 (51%) right without it.
Options leak the question. The four options of the MMLU chemistry item printed above practically spell out a half-life problem, and a model that can infer the question can try to solve it. (On that item Haiku’s options-only guess, A, was wrong.) Balepur et al. found the same: models “have some ability to infer a relevant question from choices”, but that “cannot fully explain” the accuracy, and priors over single options don’t either, which points to models using how the options relate to each other as a group. Some of this is real skill, but it means part of the score measures reading the options.
Probe 2: take the right answer away
The second probe swaps the correct option’s text for “None of the other options” (call it NOTA, for “none of the above”), keeping its letter, so it stays the right answer. A model that knows the answer rejects the other three and picks it. As a control, another version swaps one wrong option instead, so the real answer is still listed and NOTA is wrong. Same 1,140 MMLU items, one reply each, differences paired with a 95% bootstrap interval:
| MMLU version | Accuracy | Change from the normal version |
|---|---|---|
| Normal: question and four options | 85.3% (83.1 to 87.2) | |
| A wrong option swapped for NOTA | 81.1% (78.7 to 83.2) | −4.2 points (−6.1 to −2.4) |
| The right option swapped for NOTA | 52.7% (49.8 to 55.6) | −32.5 points (−35.7 to −29.4) |
Adding a NOTA option costs 4 points. Removing the right answer’s text costs 33. Of the 972 items Haiku answered correctly in the normal format, it got 410 wrong once the right text was gone. On the half-life question above, with “12.5% of the isotope is left” replaced, it answered “12.5% of the isotope decayed”: it had the right number and attached it to the wrong option.
Swipe to pan the diagram, or tap it to zoom.
Picking the best of four options is easier than knowing that three are wrong, and both are easier than producing the answer with no options at all, which is what a user asking a question needs. Some of the 33-point drop is fair: on “which is the best explanation” questions, a NOTA answer can be arguable. But the gap shows how much of a multiple-choice score comes from comparing the options offered, an ecological-validity problem no amount of extra items fixes.
Step 4: Goodhart’s law
The anthropologist Marilyn Strathern, writing about university audits in 1997, gave the version most people quote: “When a measure becomes a target, it ceases to be a good measure.” Her next sentence is the part that matters for benchmarks: “The more a 2.1 examination performance becomes an expectation, the poorer it becomes as a discriminator of individual performances.” Following the educationalist K. Hoskin, she calls this Goodhart’s law, after the economist Charles Goodhart’s observation about instruments for monetary control.
A public leaderboard turns a benchmark score into a target, and there are many ways to hit it without getting better at what it measured: tuning toward the test’s format, training on text that contains the test items, or trying many versions of a model and reporting the best.
The last one needs only noise. Suppose a lab trains N variants that are all equally good, with a true accuracy of 80%, and each is scored on its own random draw of 1,000 items, as happens when every variant faces different prompts in an arena. A Monte Carlo simulation (200,000 trials, best_of_n.py) gives the expected best score:
| Variants tried (N) | Expected best score | Gain from picking the best |
|---|---|---|
| 1 | 80.0% | none |
| 2 | 80.7% | +0.7 points |
| 5 | 81.5% | +1.5 points |
| 10 | 81.9% | +1.9 points |
| 27 | 82.5% | +2.5 points |
One run has a standard error of 1.26 points, so none of these gaps would stand out on its own. But the reported score is the maximum of N draws, and the model itself is no better.
“The Leaderboard Illusion” (Singh et al., 2025) audited Chatbot Arena, the crowdsourced leaderboard where people vote between two anonymous models’ answers (now LMArena; Part 7 covers how its ratings work). The authors found that “we identify 27 private LLM variants tested by Meta in the lead-up to the Llama-4 release”, and that the arena does not require private variants to be published. Meta’s own Llama 4 launch post (April 5, 2025) credited its “ELO of 1417 on LMArena” to “an experimental chat version” of Llama 4 Maverick. To measure the effect directly, the authors entered two identical copies of one of their own models, Aya-Vision-8B: they scored 1052 and 1069, with four other models ranked between them.
Data access is a quieter version of the same pressure. The paper estimates that Google and OpenAI each received about a fifth of all Arena prompts and outcomes (19.2% and 20.4%), against 29.7% for 83 open-weight models combined, and that training on arena data gave “relative performance gains of up to 112%” on ArenaHard, a test set drawn from the arena’s own distribution.
Step 5: the questions this series answers
Every problem above has a part of this series that takes it apart and measures it:
| Part | Question it answers |
|---|---|
| 2. How benchmarks are built | Where do items come from, who checks them, and how many answer keys are wrong? |
| 3. The statistics of evals | How wide is the error bar on a score, and how many items does a comparison need? |
| 4. Prompt and harness sensitivity | How far do prompt format, few-shot examples and answer parsing move a score? |
| 5. Contamination and memorization | Has the model seen the test, and how can you tell? |
| 6. Grading open-ended outputs | How do you score answers that aren’t a letter: reference metrics, rubrics or LLM judges? |
| 7. Arenas and Elo rankings | How do pairwise votes become a ranking, and what biases ride along? |
| 8. Code and math benchmarks | What do pass@k and verifiers measure, from HumanEval to SWE-bench and AIME? |
| 9. Long-context evals | Do needle-in-a-haystack tests show whether a model can use a long context? |
| 10. Safety and capability evals | How are dangerous capabilities and refusals measured, and what can’t be measured? |
| 11. Reading a model card | How should you read reported numbers, and build an eval of your own? |
In the real world
- MMLU’s own arc shows the lifecycle. In 2020 its authors found that “the very largest GPT-3 model improves over random chance by almost 20 percentage points on average”. By 2024 the MMLU-Pro paper said performance “has begun to plateau”, and its rebuild caused “a significant drop in accuracy by 16% to 33% compared to MMLU”. Haiku 5.5 dropped 14 points here, from 85.3% to 71.0%.
- The 2026 AI Index (read 2026-11-04) says SWE-bench Verified performance “rose from 60% to near 100% in a single year”, and that several models “meet or exceed human baselines on PhD-level science questions”. The same report notes that “the top model reads analog clocks correctly just 50.1% of the time”. A benchmark suite that never asks about clocks can’t see that gap, which is a content-validity problem in one sentence.
- Scoring by probabilities, as the open models were here, needs the model’s token log-probabilities. The Claude API doesn’t return them, so API models are scored on the text they generate, and the two methods aren’t directly comparable.
- Sudden “emergent” jumps in benchmark scores can come from the choice of metric rather than the model, an argument covered in Pretraining and scaling laws.
- Product evals face the same threats in miniature. The support-bot eval suite checks that offline scores track online outcomes (external validity) and retires saturated cases, and trustworthy LLM judges treats a judge as a measuring instrument that must be calibrated.
Common misconceptions
- “A higher score means a better model.” It means a better score on those items, with that prompt and scoring rule, within an error bar. Haiku and Sonnet tie on ARC-Easy and differ by 22.5 points on MMLU-Pro.
- “Saturated means solved.” A saturated benchmark has stopped separating the top models; the skill isn’t necessarily mastered, and part of the last gap is flawed answer keys. Saturated sets stay useful as regression tests: a sudden drop still means something broke.
- “Multiple-choice accuracy measures knowledge.” It measures choosing among given options. Haiku scored 47.7% on MMLU with no question at all, and lost 32.5 points when it had to recognize that every listed option was wrong.
- “More items fix a bad benchmark.” More items shrink the error bar, which improves reliability. They don’t fix validity: a million questions that can be answered from the options alone still measure option-reading.
- “Goodhart’s law needs someone to cheat.” Picking the best of 27 equally good variants raises the expected score by 2.5 points with no cheating at all, and two identical checkpoints on Chatbot Arena landed 17 points apart.
Key takeaways
- A benchmark score is an observation on a few hundred or thousand items. Every claim beyond that, to other items, to an ability and to real use, is an inference that can fail.
- Validity asks whether a score is about the right thing; reliability asks whether it would come out the same again. They fail independently, and a precise score can still be wrong.
- Benchmarks saturate, and faster than they used to. When the best models sit at the ceiling, a hard successor separates them again: 0 points between Haiku and Sonnet on ARC-Easy, 22.5 on MMLU-Pro.
- Probes that change the test tell you what a score measures. Hiding the question left Haiku at 47.7% on MMLU, and removing the right answer’s text cost it 32.5 points.
- Once a score becomes a target, it drifts away from what it measured, through tuning to the test, leaked items, or simply reporting the best of many tries.
What’s next
Part 2 is about how a benchmark gets built. It follows the line from MMLU through GPQA to Humanity’s Last Exam, looks at who writes the items and how they are checked, and runs Claude Haiku 5.5 on a re-annotated version of MMLU to count how many of its “mistakes” are really mistakes in the answer key.
Further reading
- AI and the Everything in the Whole Wide World Benchmark (Raji, Bender, Paullada, Denton and Hanna, 2021): the construct-validity case against benchmarks sold as measures of general ability.
- Measuring what Matters: Construct Validity in Large Language Model Benchmarks (Bean et al., 2025): a review of 445 LLM benchmarks with eight recommendations and a checklist.
- Dynabench: Rethinking Benchmarking in NLP (Kiela et al., 2021): how fast benchmarks saturate, and dynamic benchmarking with humans and models in the loop.
- Mapping global dynamics of benchmark creation and saturation in artificial intelligence (Ott et al., 2022): 3,765 benchmarks and their state-of-the-art curves.
- The Leaderboard Illusion (Singh et al., 2025): private testing, selective reporting and data access on Chatbot Arena.
- Artifacts or Abduction: How Do LLMs Answer Multiple-Choice Questions Without the Question? (Balepur, Ravichander and Rudinger, 2024): the choices-only probe and what explains it.
- ‘Improving ratings’: audit in the British University system (Strathern, 1997): the source of “When a measure becomes a target, it ceases to be a good measure.”
- Measuring Massive Multitask Language Understanding (Hendrycks et al., 2020) and MMLU-Pro (Wang et al., 2024): the benchmark and its harder successor used here.
- Think you have Solved Question Answering? Try ARC (Clark et al., 2018): ARC-Easy and ARC-Challenge.
- Stanford HAI AI Index 2025 and 2026: yearly data on benchmark progress.
- Building an Eval Suite for a Customer Support Bot: the practical side, building evals from real failures.