
Measuring LLMs: Evals and Benchmarks · Part 7 of 11
Arenas and Elo Rankings: How Pairwise Votes Become a Leaderboard
Online Elo vs Bradley-Terry on 135,632 real arena votes: order effects, votes needed per gap, style control, and a mini arena judged by Claude.
On this page
TL;DR
An arena ranks models from pairwise votes: a person asks two anonymous models the same question and picks the better answer. This part refits 135,632 public arena votes on 52 models four ways and measures what each choice does to the leaderboard. Online Elo, the chess-style running update, depends on the order of the votes: shuffling them moved a model’s rating by up to ±34 points at K = 4, while the Bradley-Terry fit that replaced it has a median 95% interval of ±7.7 points. Separating two models 10 points apart takes about 13,700 votes each. Adding answer length and markdown counts to the model moved Claude Opus 4 from 28th to 9th, and in a small arena judged by Claude Haiku 5.5 the same answers padded with detail and markdown went from first place to last once style was controlled.
Why it matters
Take 135,632 votes from a public arena and compute ratings with the textbook Elo update. Replay the same votes in the order they were cast with K = 32, a common chess setting, and Claude Sonnet 4 finishes 6th of 52. Fit all the votes at once with Bradley-Terry, and it is 38th.
That is a 32-place difference from identical data. Add four numbers per vote, how long each answer was and how much markdown it used, and Sonnet 4 moves again, to 19th. Which of these is the “real” ranking depends on what you think the voters were measuring.
Arenas are the one widely watched leaderboard built from human preference on open-ended prompts, and model launches quote them. Part 1 covered how selective submission can game one. This part is about the arithmetic underneath: how votes become ratings, how many votes a gap needs, and what a rating can and can’t tell you.
The intuition
Think of a chess club with two ways to rank its members. The first is a ladder: after every game the winner takes a few points from the loser, more if the loser was rated higher. The second is a season table: at the end of the year, someone takes every result and finds the set of strengths that best explains all of them at once.
The ladder is online Elo, and it is built for players whose strength changes: recent games count most, so a junior who improves climbs quickly. The season table is Bradley-Terry, and it assumes each player’s strength is fixed for the season, so the order of games doesn’t matter. A model checkpoint behind an arena is closer to a fixed player than a growing junior, which is why arenas moved from the ladder to the table.
The analogy breaks in two places. A chess game has a winner by the rules; an arena vote is one person’s taste on one prompt they chose. And chess players don’t get extra wins for writing longer moves, while models, as Step 4 measures, do.
Step 1: how an arena collects votes
Chatbot Arena started at LMSYS in April 2023 and now runs at arena.ai, under the name Arena. The how-it-works page (read November 4, 2026) describes the loop: “In battle mode, you’ll be served 2 anonymous models.” You vote for the answer you prefer, and then: “After voting, the model identities are revealed.” The Chiang et al. (2024) paper adds the details. Users may type any prompt, the voting buttons are A, B, “tie” and “both are bad”, and conversations that mention model names or companies are filtered out to keep the vote blind. By January 2024 it had “over 240K votes from about 90K users in over 100 different languages”.

The votes used here
The data is lmarena-ai/arena-human-preference-140k on Hugging Face (prompts under CC-BY-4.0; model outputs under each provider’s terms). It holds 135,634 text votes cast between April 17 and July 24, 2025. Only model names, outcomes, timestamps, language and code flags, and the dataset’s own style counts (answer tokens, markdown headers, list items, bold spans) were kept; no conversation text was stored or is quoted here. One model with only 2 votes was dropped, leaving 135,632 votes on 52 models, a median of 5,710 votes per model.
The prompt mix matters for what the ratings mean:
| Slice of the 135,632 votes | Votes | Share |
|---|---|---|
| English prompts | 71,174 | 52.5% |
| Polish prompts | 13,813 | 10.2% |
| Russian prompts | 9,263 | 6.8% |
| Chinese prompts | 6,501 | 4.8% |
| Flagged as code | 39,363 | 29.0% |
| Multi-turn conversations | 19,201 | 14.2% |
| Outcome: tie | 21,531 | 15.9% |
| Outcome: both bad | 15,753 | 11.6% |
One vote in ten is in Polish and nearly three in ten involve code, so a rating averages over whoever showed up and whatever they asked.
Step 2: online Elo vs Bradley-Terry
The Elo update
Both methods use the same scale. A gap of d rating points means the stronger model is expected to win with probability:
P(A beats B) = 1 / (1 + 10^(-d / 400))A 100-point gap gives 64.0%; a 400-point gap gives 90.9%; equal ratings give 50%. Ties count as half a win and half a loss.
Online Elo walks through the votes one at a time. After each vote, the left model’s rating moves by K × (result - expected) and the right model’s moves by the same amount the other way. Two models at 1,000 have an expected result of 0.5, so a win at K = 4 moves them to 1,002 and 998. If a model rated 1,100 loses to one rated 1,000, it drops by 4 × 0.640 = 2.56 points.
The constant K, the K-factor, sets the memory. A rating’s error shrinks by roughly a factor of 1 - K × ln(10)/400 × 0.25 per vote, so at K = 4 a rating mostly reflects its last 174 votes, and at K = 32 its last 22. A short memory also means a noise floor that more votes never remove. With this dataset’s tie rate, one vote’s score (0, 0.5 or 1) has a variance of 0.181, and the formula sqrt(K × Var(result) / (2 × ln(10)/400 × 0.25)) gives a standard deviation of about 15.9 points at K = 4 and 44.9 at K = 32.
The Bradley-Terry fit
Bradley-Terry, covered in Math Part 16 as the reward-model loss, uses the same win formula but finds all 52 ratings at once by maximum likelihood: the ratings that make the observed votes most probable. It is a logistic regression with one coefficient per model. LMArena’s December 2023 post gives the reason for the switch: “we have access to the entire history of all games for all models and so we don’t need a decentralized algorithm,” and “most models are static.” It also admits that its earlier fix, averaging Elo over 1,000 shuffles of the votes, gave intervals that were “too wide.”
The experiment module, evals/lab/arena.py, implements both, following LMArena’s open code (FastChat’s rating_systems.py). Its Bradley-Terry fit agrees with an independent statsmodels fit within 1.2 points and matches each model’s actual and expected wins to 0.03 votes. The core of Experiment 1:
import sys; sys.path.insert(0, "../evals/lab")
import numpy as np, pandas as pd, arena

df = pd.read_csv("data/e07-votes.csv").sort_values("ts")   # 135,634 votes
a, b, y, models = arena.encode(df.model_a, df.model_b, df.winner)
M = len(models)

bt = arena.fit_bt(a, b, y, M)                       # order-free maximum likelihood
elo = arena.online_elo(a, b, y, M, k=4)             # replay votes in time order
shuffled = arena.online_elo(a, b, y, M, k=4, order=np.random.default_rng(0).permutation(len(y)))

i = models.index("gemini-2.5-pro")
print(round(bt[i]), round(elo[i]), round(shuffled[i]))
It prints 1124 1116 1133: three ratings for one model from one set of votes, up to 17 points apart. (The listing keeps the model with 2 votes; dropping it changes nothing visible here.)
Experiment 1: the same votes in 200 orders
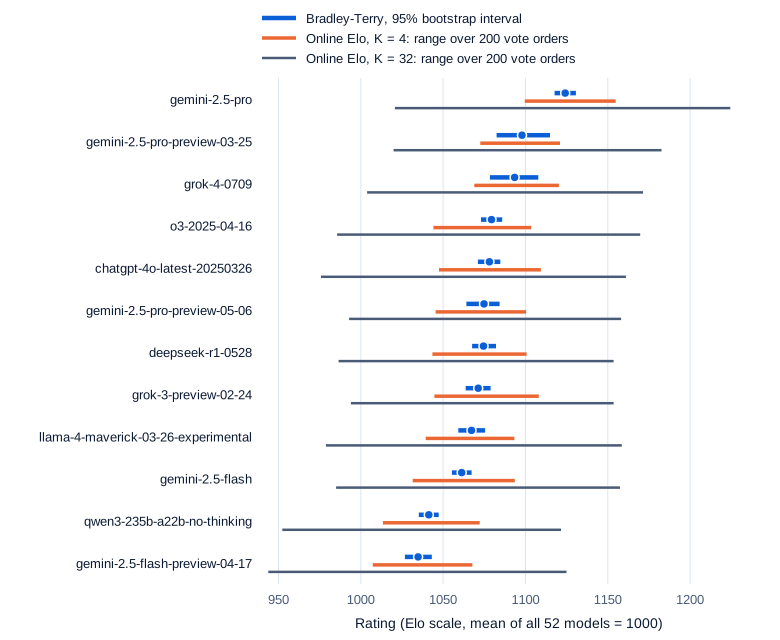
The full run (all ratings shifted so the 52 models average 1,000) fits Bradley-Terry with 1,000 bootstrap resamples of the votes. It then replays online Elo in time order, in reverse, and in 200 random orders, at K = 4 and K = 32. Kendall’s tau, a rank correlation where 1 means the same order and 0 means unrelated, compares each ranking with Bradley-Terry’s:
| Method | Kendall’s tau vs BT | Largest rank change | Mean rank change |
|---|---|---|---|
| Online Elo, K = 4, time order | 0.834 | 10 | 3.4 |
| Online Elo, K = 4, reverse order | 0.798 | 12 | 3.8 |
| Online Elo, K = 4, 200 random orders (median) | 0.846 | n/a | n/a |
| Online Elo, K = 32, time order | 0.560 | 32 | 8.2 |
| Online Elo, K = 32, 200 random orders (median) | 0.594 | n/a | n/a |
| Mean of the 200 K = 4 orders | 0.977 | 2 | 0.5 |
| BT with ties dropped | 0.986 | 2 | 0.4 |
| Rao-Kupper tie model | 0.988 | 2 | 0.3 |
Swipe to pan the diagram, or tap it to zoom.
Bradley-Terry’s 95% intervals have a median half-width of 7.7 points. Across vote orders at K = 4, the middle 95% of a model’s online Elo spans a median of ±28 points, and at K = 32, ±85. The measured standard deviations, 14.7 and 45.1 points, match the noise-floor formula’s 15.9 and 44.9. At K = 4, gemini-2.5-pro, first under Bradley-Terry, finished anywhere from 1st to 7th depending on the order; at K = 32, from 1st to 32nd.
Averaging many shuffles, LMArena’s 2023 fix, does recover the Bradley-Terry order almost exactly (tau 0.977, no rating more than 4.4 points off). It is a slow route to the same answer, and the spread of those shuffles is not a confidence interval for it.
Ties
27.5% of votes were ties or “both bad.” Dropping them barely reorders the table (at most 2 places) but stretches it: the standard deviation of ratings grows from 57.5 to 79.6 points, because the remaining votes look more decisive. The Rao-Kupper model (Rao and Kupper, 1967, cited by Chiang et al.) gives ties their own parameter instead of counting them as half a win. It fitted a tie parameter of 1.82 and moved no model more than 2 places, so the half-win convention is a safe simplification for ranking, if not for the size of the gaps.
Step 3: how many votes separate two models?
A Bradley-Terry rating built from n votes against a mix of opponents has a standard error of roughly:
SE ≈ sqrt(Var(result)) / (0.25 × ln(10)/400) / sqrt(n) ≈ 296 / sqrt(n) rating pointsVar(result) is again the variance of one vote’s score, 0.181 here. For gemini-2.5-pro’s 9,219 votes that gives 3.1 points. Against the bootstrap from Experiment 1, the formula’s standard error came out at a median of 1.00 times the bootstrap value, and between 0.94 and 1.08 times it for all 52 models. Grouping votes by user session made no difference: 135,632 votes came from 115,371 sessions, and resampling whole sessions changed the variance by a factor of 0.97, unlike the subject clustering in Part 3.
The difference between two models with n votes each has a standard error of 296 × sqrt(2/n). To detect a gap with 80% power at the 5% level, the gap must be about 2.8 of those standard errors:
| True gap (rating points) | Win rate of the stronger model | Votes per model, rated against the field | Votes, the two models only against each other |
|---|---|---|---|
| 5 | 50.7% | 55,000 | 27,500 |
| 10 | 51.4% | 13,700 | 6,900 |
| 20 | 52.9% | 3,400 | 1,700 |
| 50 | 57.1% | 550 | 280 |
| 100 | 64.0% | 137 | 73 |
A simulation of 4,000 head-to-head contests at each gap, at the table’s vote counts, found the gap 80.0% to 83.3% of the time. A 10-point gap, small on a leaderboard, is a 51.4% win rate: harder to see than the 3-point accuracy gap that needed about 1,165 paired questions in Part 3.
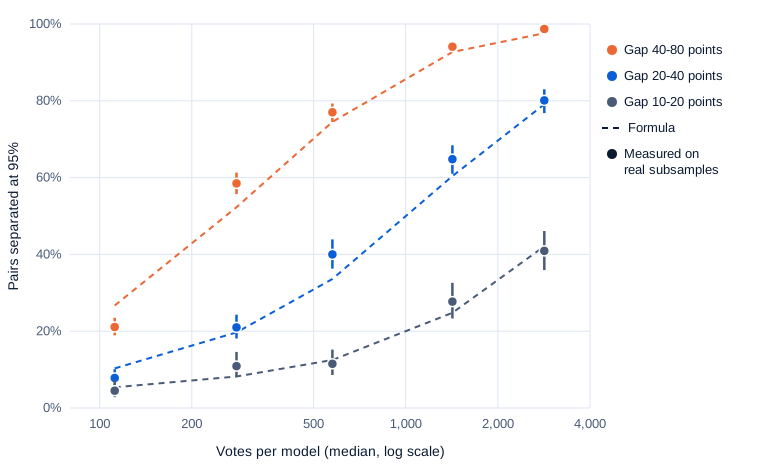
The check on real data: draw random 2% to 50% subsamples of the votes (three each), refit with 200 bootstrap resamples, and count how often a pair’s 95% interval for its difference excludes zero. Pairs are grouped by their gap in the full data.
Swipe to pan the diagram, or tap it to zoom.
The formula tracks the measurements: within 3 points in 11 of the 15 cells, and 6.4 points at most. A parametric version, with outcomes simulated from the fitted ratings on the same pairs, agreed as well. It also showed the risk at small samples: with 2% of the votes, 2.2% of pairs less than 10 points apart were “separated” in the wrong order.
Chiang et al. turn intervals into an “approximate ranking”: a model’s rank is 1 plus the number of models whose interval lies entirely above its own. On all 135,632 votes that rule gives only 21 distinct ranks to 52 models; five models share rank 2. The paper itself uses “sandwich” standard errors, a regression estimate that stays valid when the model’s assumptions are off, and an active sampling rule that serves the pairs whose intervals most need votes.
Step 4: style control
Answer length shows up immediately. In the 98,097 decisive votes where the two answers differed in length, the longer one won 61.8% of the time (61.5% to 62.1%). Longer answers can also be more complete, though. LMArena’s “Does style matter?” post (August 2024) handled this by adding style features to the regression. For each vote and each feature (answer tokens, markdown headers, list items, bold spans), take (f_A - f_B) / (f_A + f_B + 1), standardize it, and fit:
P(A wins) = sigmoid( θ_A - θ_B + γ_len z_len + γ_hdr z_hdr + γ_list z_list + γ_bold z_bold )Each θ is a model’s strength and each γ is how much one standard deviation of that style difference moves the log-odds of winning. The model ratings are now “strength at equal style”.
Experiment 3 fits it on the same votes, with 100 bootstrap resamples:
| Style feature | Coefficient, this data (95% interval) | LMArena, August 2024 |
|---|---|---|
| Answer length | 0.339 (0.322 to 0.355) | 0.249 |
| Markdown headers | 0.058 (0.044 to 0.070) | 0.024 |
| Markdown lists | 0.012 (-0.003 to 0.027) | 0.031 |
| Markdown bold | 0.039 (0.022 to 0.056) | 0.019 |
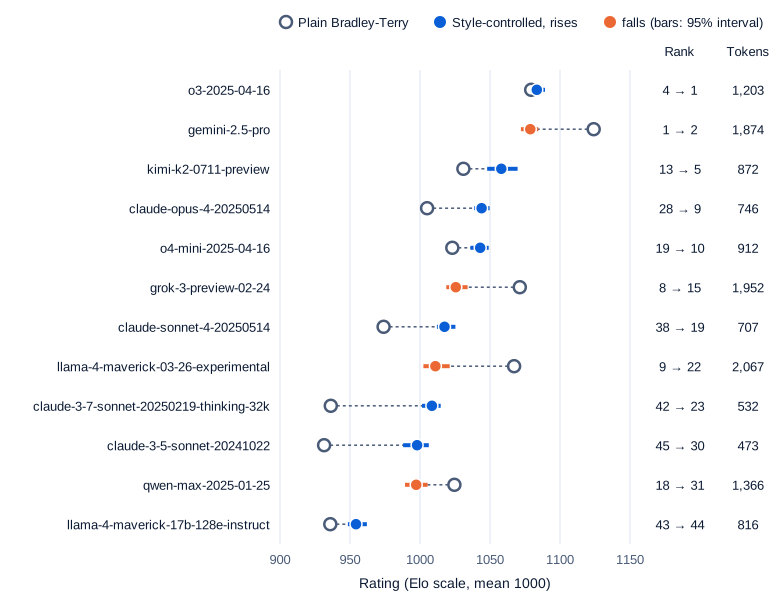
Length dominates, as it did in 2024, and its effect is larger in the 2025 votes. A coefficient of 0.339 turns an even match into 58.4% for the answer one standard deviation longer, worth about 59 rating points.
Swipe to pan the diagram, or tap it to zoom.
The ranking changes a lot: Kendall’s tau between the plain and controlled rankings is 0.668, the mean model moves 6.7 places, and six models, all Claude, move 17 to 19. How far a model’s rating dropped correlates at 0.90 with its average answer length. Claude models, whose answers averaged 473 to 840 tokens, rose most. The model that fell furthest among the top ten was llama-4-maverick-03-26-experimental, an experimental chat variant of Llama 4 Maverick, the kind of unreleased version discussed in Part 1. Its answers averaged 2,067 tokens against 816 for the released Llama 4 Maverick, and the gap between the two shrank from 131 rating points to 57.
Style control is a regression on observational data, and the LMArena post says so: “There are possible unobserved confounders such as positive correlation between length and substantive quality”. A step-by-step solution to a math problem is long because it is thorough. Controlling for length removes some of that credit too. The controlled ranking answers “who wins at equal length and formatting”, which is not the same as “who is right more often.”
The prompt mix moves rankings as well. Refit on English prompts only, the order keeps a Kendall’s tau of 0.909 with the full ranking. On code prompts it drops to 0.801, and Claude Opus 4 moves from 26th to 13th.
Step 5: a mini arena judged by Claude
Experiment 4 builds a small arena. Sixty English, single-turn, non-code prompts of 8 to 150 tokens were drawn at random (seed 0) from one shard of the same dataset. Five Claude configurations answered each one:
- Haiku 5.5 with thinking off (
thinking: {"type": "disabled"}), the Part 3 baseline. - The same, with a system prompt asking for “as much detail as possible” formatted with “headers, bullet lists and bold key phrases.”
- The same, with AlpacaEval’s concise prompt: “Be as concise as possible while still providing all the necessary information to answer the question.”
- Haiku 5.5 with adaptive thinking at low effort (
output_config: {"effort": "low"}); it thought on 30 of 60 prompts. - Sonnet 5.5 at its lowest thinking setting (
{"type": "between_tools"}).
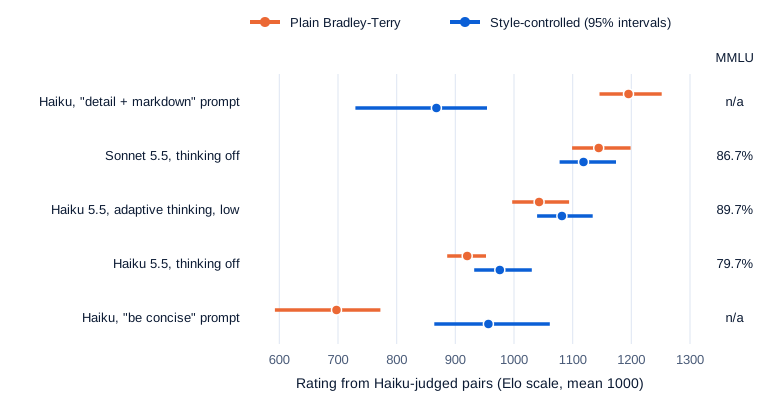
Of the 300 answers, 8 (2.7%) hit the output limit (3,000 tokens for Haiku, 2,000 for Sonnet) and one Sonnet reply was a refusal. Both were left in, as an arena would show them. Claude Haiku 5.5 with thinking off then judged every ordered pair: 60 prompts × 20 orderings = 1,200 judgments, each answered with one word, A, B or TIE. All 1,200 parsed. Ratings use Bradley-Terry with 95% intervals from resampling whole prompts.
Swipe to pan the diagram, or tap it to zoom.
The same model with the same knowledge took first place just by writing longer, more formatted answers. Its answers averaged 3,056 characters and 8.5 headers, against 1,706 characters and 0.7 headers for plain Haiku. The judge preferred it over plain Haiku in 100 of 120 head-to-head judgments (83%, 76% to 89%). With the four style features added, it drops to last. The fitted length coefficient was 1.47 (0.83 to 2.39), over four times the human voters’ 0.339. The length spread here differs from the public data, so the two are not exactly comparable, but the direction matches what Arena-Hard and AlpacaEval found with GPT-4 judges.
The judge also had a position bias: it picked the second answer more often, choosing the first in only 44.7% of decisive verdicts (41.8% to 47.5%). Swapping the order gave the same verdict for 78.0% of pairs (74.5% to 81.1%), which is why every pair was judged both ways.
Against Part 3’s MMLU scores, the arena and the exam agree on one thing and disagree on another. Both put plain Haiku last of the three real configurations. But the exam ranks Haiku with low thinking above Sonnet (89.7% vs 86.7%), while the judge preferred Sonnet, with or without style control. The intervals overlap after control (1,078 to 1,174 vs 1,039 to 1,134), so 60 prompts can’t settle it. They measure different things: a letter on a four-option question, versus a whole answer someone would want to read. A judge that is itself Haiku may also favor Haiku’s own phrasing, a self-preference that System Design: Trustworthy LLM-as-a-Judge covers.
The run cost $0.413 in all from the usage ledger: $0.032 for the pilot, $0.283 for the 300 answers (Sonnet was $0.236 of it) and $0.098 for the 1,200 judgments, all but the pilot through the Message Batches API.
In the real world
Automated arenas replace the crowd with a judge model and a fixed prompt set. Arena-Hard-Auto (Li et al., 2024) picks 500 hard prompts from 200,000 Chatbot Arena prompts and compares each model against a baseline (GPT-4-0314), with each pair judged in both orders. Its paper reports “98.6% correlation with human preference rankings” for $20 per evaluation. That figure is for the style-controlled version, compared with style-controlled Chatbot Arena rankings on English hard prompts; without style control it reports 94.9% Spearman correlation. Its Table 5 shows the risk measured above: asking Llama-3.1-70B-Instruct for more detail raised its score from 44.5 to 53.5 with a plain GPT-4-Turbo judge, and under style control the detailed version scored 39.8, below the original’s 41.7.
Length-controlled AlpacaEval (Dubois et al., 2024) applies the same regression idea to a judge’s win rates. With the plain metric, a verbosity instruction alone moved the baseline model gpt4_1106_preview from 22.9% to 64.3%. With length control the range shrank to 41.9% to 51.6%, and Spearman correlation with Chatbot Arena rose from 0.94 to 0.98.
Boubdir et al. (2023), the Cohere study the December 2023 LMArena post cites, found that “Elo ratings for LLMs are highly sensitive to the order of comparisons and the choice of hyperparameters.” Experiment 1 measured the same thing on real votes.
Some questions an arena cannot answer at all. A vote records which answer one person preferred on a prompt they chose. It does not check whether the answer was correct: in Chiang et al.’s own audit, crowd votes agreed with experts 72% to 83% of the time, while two experts agreed with each other 79.4% to 89.8%. It says nothing about your prompts, your domain or long agentic tasks (Agentic AI Part 11 covers those). And it inherits whatever the crowd asks about: in this sample, more Polish than Chinese, and code in 29% of votes.
Common misconceptions
- “An Elo rating is a fixed property of a model.” Online Elo depends on the order of the votes and on K. Shuffling the same votes moved ratings across a median ±28-point range at K = 4. Arenas now publish Bradley-Terry ratings, which depend only on the set of votes, not their order.
- “A 10-point lead means the top model is better.” Ten points is a 51.4% expected win rate. Telling it apart from zero needs about 13,700 votes per model at 80% power, and the interval-based rank rule put five models at rank 2 on 135,632 votes.
- “Ties don’t matter.” They didn’t change the order here, but dropping the 27.5% of tied votes stretched the rating spread by 38%, so gaps look bigger than they are.
- “Style control finds the truly best model.” It removes the part of the win rate explained by length and markdown, including any real quality that comes with length. It is a regression on observational data, not an experiment.
- “An LLM judge removes human bias.” In Experiment 4 the Haiku judge was more length-driven than the crowd and favored the second position. Automated arenas need the same both-orders, style-controlled treatment.
Key takeaways
- Online Elo is a ladder with a short memory. On the same votes, its rankings moved by up to 10 places at K = 4 and 32 places at K = 32. Fit all votes at once with Bradley-Terry and the order stops mattering.
- A rating’s error bar is about 296 divided by the square root of its vote count. Two models 10 points apart need around 13,700 votes each before you can tell them apart.
- Length is the biggest style effect. Longer answers won 62% of decisive votes, and controlling for length and markdown moved the average model almost 7 places.
- In a Claude-judged arena, formatting alone lifted Haiku from fourth place to first, and style control sent the same answers to last.
- An arena measures what its voters prefer on what they ask. Read the prompt mix before the rank.
What’s next
Preferences are hard to pin down; some answers can simply be checked. Part 8 turns to code and math benchmarks, where a test suite or a symbolic checker grades the answer. It measures how often those verifiers are wrong and what pass@k really estimates.
Further reading
- Chatbot Arena: An Open Platform for Evaluating LLMs by Human Preference (Chiang et al., 2024): the platform, Bradley-Terry with sandwich intervals, active sampling, and crowd-vs-expert agreement.
- Chatbot Arena: New models & Elo system update (LMSYS, 2023): why the leaderboard moved from online Elo to Bradley-Terry.
- Chatbot Arena: Benchmarking LLMs in the Wild with Elo Ratings (LMSYS, 2023): the launch post, with 4.7k votes in the first week.
- Does style matter? Disentangling style and substance in Chatbot Arena (Li, Angelopoulos and Chiang, 2024): the style-control regression and its coefficients.
- Elo Uncovered: Robustness and Best Practices in Language Model Evaluation (Boubdir et al., 2023): order and K-factor sensitivity of Elo for LLMs.
- From Crowdsourced Data to High-Quality Benchmarks: Arena-Hard and BenchBuilder Pipeline (Li et al., 2024): an automated arena with style control.
- Length-Controlled AlpacaEval (Dubois et al., 2024): regression-based length control for LLM judges.
- The Leaderboard Illusion (Singh et al., 2025): private testing and data access on Chatbot Arena, summarized in Part 1.
- FastChat rating_systems.py (LMSYS): the open code for Elo, Bradley-Terry, bootstrap and style control.
- arena-human-preference-140k (LMArena, Hugging Face): the votes used in this article.