
Agentic AI: How AI Agents Work · Part 11 of 16
Evaluating Agents: pass@k, pass^k and Run-to-Run Noise, Measured
SWE-bench, τ-bench, OSWorld and GAIA explained, then 1,140 repeated agent runs: pass@k vs pass^k, run-to-run spread, cost per solved task and judge agreement.
On this page
TL;DR
An agent benchmark is a set of tasks, an environment and a grader, and its score depends on how often you run each task. This article explains what SWE-bench, τ-bench, OSWorld and GAIA measure and how pass@1, pass@k and pass^k are estimated, then runs 64 tasks from earlier parts 10 times each (5 times for Sonnet): 1,140 runs on Claude Haiku 5.5 and Sonnet 5.5. On 28 coding bugs, Haiku’s pass@1 was 85.0%, it succeeded on all 10 runs of only 71.4% of tasks, and whole-benchmark scores ranged from 75.0% to 92.9%. Sonnet scored 5 points higher at 6.9 times the cost per solved task, a gap that would take roughly 170 to 360 tasks to confirm. An LLM judge that agreed with the tests on 93.8% of runs widened that gap to 8.6 points.
Why it matters
Claude Haiku 5.5 ran the same 28 coding tasks ten times, with the same tools, prompt and settings. Its score was 89.3% on the first pass, 75.0% on the second and 92.9% on the fifth. Pick one run and you could report any of those.
The average, 85.0%, hides two other facts. Keep any success out of ten runs and it solves 96.4% of tasks. Demand success on all ten, as a customer who uses it daily effectively does, and it manages 71.4%.
Part 8 could not tell Haiku from Sonnet on these bugs, and Part 10 ran its smaller arms once. This part is about the measuring: which statistic answers which question, and how many tasks and repeats make a difference mean something. The System Design posts on support-bot eval suites and trustworthy LLM judges cover building suites and calibrating judges; this part measures the noise underneath both.
The intuition
Think of a basketball player at the free-throw line. She shoots 10, makes 7, and the coach writes down 70%. Two other questions have different answers. If every shot is a 70% chance, “will she make at least one of her next three?” is almost certain, 97%, while “will she make all three?” is only 34%.
Agent evals ask all three. pass@1 is the shooting percentage. pass@k asks whether at least one of k attempts succeeds, which matters when something checks the work and you keep the best attempt. pass^k asks whether all k succeed, which matters when every attempt reaches a customer.
The analogy breaks in one important way. A shooter’s chance is about the same on every shot. An agent’s isn’t: some tasks it solves every time, some never, and the rest only sometimes. Most of what follows comes from that difference.
Step 1: what the big agent benchmarks measure
An agent benchmark has three parts: a set of tasks, an environment the agent acts in, and a grader that decides whether each attempt succeeded. Anthropic’s guide to agent evals (Demystifying evals for AI agents, January 2026) names the pieces this article uses: a task is “a single test with defined inputs and success criteria”, “each attempt at a task is a trial”, and a grader is “logic that scores some aspect of the agent’s performance”.
| Benchmark | Tasks | Environment | Grader | At release |
|---|---|---|---|---|
| SWE-bench (2023) | 2,294 GitHub issues in 12 Python repos | the repository at the issue’s commit | hidden fail-to-pass and pass-to-pass tests | best model 1.96% |
| GAIA (2023) | 466 questions in 3 levels | the open web, files, any tools | quasi exact match against one answer | humans 92%, GPT-4 with plugins 15% |
| OSWorld (2024) | 369 desktop tasks | a full virtual machine (Ubuntu) | 134 execution-based checker functions | humans 72.36%, best model 12.24% |
| τ-bench (2024) | 115 retail and 50 airline tasks | tools over a database, a policy document, an LLM playing the user | final database state equals the goal state, plus required facts in replies | gpt-4o 61.2% retail, 35.2% airline |
Part 8 covered SWE-bench, its 500-task Verified subset and why OpenAI stopped reporting Verified over contamination. Its successor in Anthropic’s system cards, SWE-bench Pro (Scale AI, 2025), has 1,865 problems from 41 repositories in public, held-out and commercial sets, using copyleft (GPL) and private startup code to stay out of training data.
GAIA (Mialon et al., 2023) asks questions that are easy for people and hard for models, each with one short answer, from level 1 (at most one tool and 5 steps) to level 3 (“arbitrarily long sequences of actions”). It publishes 300 of its questions with the answers withheld, so a leaderboard can grade them without the answers leaking.
OSWorld (Xie et al., 2024) gives the agent a real desktop and checks the result with a script per task. Its 12.24% was GPT-4 reading the accessibility tree, a text description of the screen (Part 9 compared that with screenshots). In July 2025 its authors released OSWorld-Verified after about two months of fixing 300+ reported problems, mostly in the checkers. The same post shows one model scoring anywhere from 9.1% to 23.0% depending on its step budget.
τ-bench (Yao et al., 2024) is the closest to a customer-facing agent. A language model plays a customer with a goal; the agent talks to it, follows a written policy and calls tools that change a database. A run succeeds if the database ends up identical to the goal state and the agent told the user every required fact. The simulated user samples at temperature 1.0, so every run is a different conversation, and the paper introduced pass^k to measure that. τ²-bench (Barres et al., 2025) adds a telecom domain where the user also has tools.
Benchmarks are software, and software has bugs
A grader is code, and it can be wrong in both directions. The ABC checklist paper (Zhu et al., 2025) audited ten agent benchmarks and found flawed outcome checks in seven. τ-bench counted an empty response as success on intentionally impossible tasks, so an agent that did nothing scored 38% on the airline set and beat a GPT-4o agent. Such flaws “can lead to under- or overestimation of agents’ performance by up to 100% in relative terms.”
Step 2: pass@1, pass@k and pass^k
Estimating them from n runs
Run each task n times and count the c runs that succeed. The obvious estimate of pass@1 is c / n. For pass@k you could take that rate p and compute 1 - (1 - p)^k, but the Codex paper (Chen et al., 2021) showed that this “results in a consistent underestimate”. Its unbiased estimator instead asks: if you drew k of the n runs at random without replacement, how likely is it that at least one succeeded?
pass@k = 1 - C(n - c, k) / C(n, k) C(a, b) = number of ways to choose b items from aThe τ-bench paper defined pass^k as “the chance that all k i.i.d. task trials are successful, averaged across tasks” (i.i.d.: independent and identically distributed), and estimated it the same way: the chance that k runs drawn from the n all succeeded.
pass^k = C(c, k) / C(n, k)Both are computed per task and then averaged over tasks. Take the shooter’s numbers as one task: n = 10, c = 7, k = 3. There are C(10, 3) = 120 ways to pick 3 runs. Only C(3, 3) = 1 of them is all failures, so pass@3 = 1 - 1/120 = 99.2%; the shortcut 1 - 0.3^3 gives 97.3%. C(7, 3) = 35 of them are all successes, so pass^3 = 35/120 = 29.2%; the shortcut 0.7^3 gives 34.3%. Averaged over many experiments, the shortcuts understate pass@k and overstate pass^k; the counting estimators don’t.
The lab’s new module, evals.py, holds these and the statistics below. It imports nothing from the API:
from math import comb


def pass_at_k(n, c, k):
    """P(at least one of k runs succeeds), estimated from c successes in n runs (needs k <= n)."""
    if n - c < k:
        return 1.0
    return 1.0 - comb(n - c, k) / comb(n, k)


def pass_hat_k(n, c, k):
    """P(all k runs succeed), estimated from c successes in n runs (needs k <= n)."""
    return comb(c, k) / comb(n, k)
Swipe to pan the diagram, or tap it to zoom.
Each run becomes one row of task, repeat, success and cost; every statistic below is computed from those rows, and none from a single run.
Step 3: two task sets, every task ten times
The setup
Two task sets from earlier parts, both graded by code, not by a model:
- Questions: the 36 Saltmere Islands tasks from Part 3, lookup chains, aggregates, shortest routes and puzzles over a fictional archipelago, each with one exact answer, in the style of GAIA.
- Coding: the 28 real bugs from 9 Python libraries built in Part 8, graded like SWE-bench by hidden fail-to-pass and pass-to-pass tests. The agent gets only the issue’s title, the setting where Part 8 saw the most failures, and the full tool kit.
Each task ran 10 times per configuration (Sonnet 5 times), each run in a fresh environment:
| Configuration | Model | Thinking and effort | Limits |
|---|---|---|---|
| Questions, thinking off | claude-haiku-5-5 | thinking disabled, effort medium | 20 steps, max_tokens 4,000, $0.05 per run |
| Questions, thinking low | claude-haiku-5-5 | adaptive thinking, effort low | 20 steps, max_tokens 20,000, $0.05 per run |
| Coding, Haiku | claude-haiku-5-5 | adaptive thinking, effort medium | 50 steps, max_tokens 32,000, $0.20 per run |
| Coding, Sonnet | claude-sonnet-5-5 | adaptive thinking, effort medium | 50 steps, max_tokens 32,000, $2.00 per run |
The agent loop is Part 3’s react.run_loop with prompt caching; the runner (run.py) keeps 3 runs in flight and resumes after a crash. No run hit a step or cost limit; one question run used up its 4,000 output tokens and counts as a failure. Costs come from the lab’s ledger.
The results
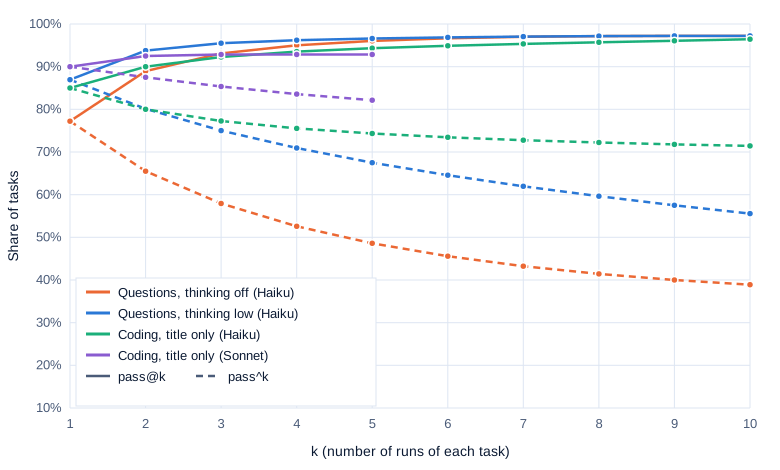
| Configuration | Tasks × runs | pass@1 (95% CI) | pass@5 | pass^5 | pass@10 | pass^10 | Cost per run | Cost per solved run |
|---|---|---|---|---|---|---|---|---|
| Questions, thinking off | 36 × 10 | 77.2% (68.1-85.6) | 96.1% | 48.6% | 97.2% | 38.9% | $0.00137 | $0.00177 |
| Questions, thinking low | 36 × 10 | 86.9% (78.9-93.6) | 96.6% | 67.5% | 97.2% | 55.6% | $0.00192 | $0.00221 |
| Coding, Haiku | 28 × 10 | 85.0% (73.6-94.6) | 94.3% | 74.3% | 96.4% | 71.4% | $0.00261 | $0.00307 |
| Coding, Sonnet | 28 × 5 | 90.0% (79.3-98.6) | 92.9% | 82.1% | not run | not run | $0.01905 | $0.02116 |
The pass@1 interval resamples whole tasks, as explained in Step 4.
Swipe to pan the diagram, or tap it to zoom.
The gap between the solid and dashed lines at k = 10 is the agent’s inconsistency.
Where the failures sit
The curves bend because success is uneven across tasks. On the coding set, Haiku solved 20 of 28 tasks in all 10 runs and one task, a tomlkit array bug, in none. The other 7 tasks were flaky. One of them, “Out-of-range timezone minutes are silently accepted”, was fixed in 3 of 10 runs. The passing runs added a range check where the offset is computed:
+            if not 0 <= tzm_int <= 59:
+                raise ValueError("timezone minutes out of range: %r" % tz)
All 7 failing runs instead tightened the regular expression for strftime-style %z directives, "%z": "(?:[+-][0-9]{2}:?[0-5][0-9]..., and left the reported case untouched. The model, prompt and repository were identical; only the diagnosis differed.
On the questions, every run of the oldest mayor’s age gap answered 3 instead of -3, the sign error Part 3 traced; no number of retries fixes a mistake made every time. With thinking off, 21 of the 36 questions were flaky.
Why p^k is the wrong shortcut
If every task had the same success rate, pass^k would be pass@1 to the power k, the 0.9^8 ≈ 0.43 the support-bot eval post used to show how fast consistency decays. On real task sets that is far too pessimistic:
| Configuration | pass@1 | (pass@1)^10 | Measured pass^10 | 1 - (1 - pass@1)^10 | Measured pass@10 |
|---|---|---|---|---|---|
| Questions, thinking off | 77.2% | 7.5% | 38.9% | 100.0% | 97.2% |
| Coding, Haiku | 85.0% | 19.7% | 71.4% | 100.0% | 96.4% |
Whenever tasks differ, the average of per-task powers exceeds the power of the average, so the shortcut understates pass^k and overstates pass@k. A task solved every time adds 1 to pass^k at every k; a task never solved adds 0 to pass@k at every k, so both have to be measured, not derived.
Step 4: how far a score moves from run to run
Ten benchmark runs, ten scores
Treat each repeat as one complete benchmark run, every task once, and you get ten scores per configuration:
| Configuration | Lowest run | Highest run | Mean | Standard deviation |
|---|---|---|---|---|
| Questions, thinking off | 69.4% | 86.1% | 77.2% | 5.4 points |
| Questions, thinking low | 80.6% | 94.4% | 86.9% | 4.4 points |
| Coding, Haiku | 75.0% | 92.9% | 85.0% | 6.0 points |
| Coding, Sonnet (5 runs) | 89.3% | 92.9% | 90.0% | 1.6 points |
A single benchmark run of a Haiku configuration landed anywhere in a 14- to 18-point range. If each task’s runs are independent coin flips with that task’s own success rate p_i, the standard deviation of the score over T tasks is sqrt(Σ p_i (1 - p_i)) / T. For the questions that predicts 5.4 and 4.1 points, close to what was observed. For Haiku on code it predicts 4.0 against 6.0 observed; shuffling each task’s runs across repeats 20,000 times gave a spread that large only 2.7% of the time, a hint that some repeats were worse across the board. One configuration in four is weak evidence, but Anthropic’s infrastructure noise study recommends running “at multiple times and on multiple days” for exactly this reason.
Across days, the averages held: Part 3 measured the thinking-off questions at 76.9% and Part 8 measured title-only bugs at 85.7% for Haiku and 91.1% for Sonnet; this part measured 77.2%, 85.0% and 90.0%.
Two sources of noise, two kinds of interval
A score has two sources of uncertainty: run-to-run noise inside each task, which repeats shrink, and which tasks you happened to pick, which only more tasks shrink. Evan Miller’s Adding Error Bars to Evals (2024) writes the variance of the mean score over n questions, each answered K times, as:
Var(score) = (Var(x) + E[σ_i²] / K) / nwhere Var(x) is the spread of true per-question rates and E[σ_i²] the average within-question variance. On the coding set with Haiku the two were 0.086 and 0.045: even with one run per task, most of the uncertainty comes from the choice of tasks.
So the interval matters. A Wilson interval, a confidence interval for a proportion that treats all 280 coding runs as independent, gives 80.3% to 88.7% for Haiku. Resampling whole tasks with all their runs, the task_bootstrap function in evals.py, gives 73.6% to 94.6%, 2.5 times as wide. Miller found such clustered standard errors “over 3X larger than naive standard errors” on one public eval. The Wilson interval roughly answers “would I get the same score if I reran these exact tasks?”; the task bootstrap answers “how well does this agent do on tasks like these?”. Claims about an agent need the second.
Step 5: how many tasks to tell two agents apart
Pair the runs by task
Compare configurations on the same tasks and analyze per-task differences, so a hard task counts against both. Turning thinking on at effort low for the questions helped 15 tasks, hurt 5 and left 16 unchanged: a gain of 9.7 points, 95% interval +2.5 to +16.9 from resampling tasks, p = 0.016 from a sign-flip permutation test, which flips the sign of each task’s difference at random to see how often chance alone gives a gap that large. Haiku against Sonnet on code went the other way. Over the first 5 runs of each, Sonnet was better on 5 tasks, worse on 2 and tied on 21, a mean gain of 3.6 points with a 95% interval from -3.6 to +10.7 (p = 0.46). The 28 tasks cannot say whether Sonnet is better here.
Power: tasks matter more than repeats
Statistical power is the chance an experiment detects a difference that is really there; 80% is the usual target. Taking each task’s measured rates as the truth, paired_power in evals.py simulates experiments with T such tasks run R times each and counts how often a paired test finds the gap at the 5% level. Miller’s formula for the number of tasks gives the same picture:
n = (1.96 + 0.84)² × (ω² + σ_A²/K + σ_B²/K) / δ²Here δ is the true gap, ω² the variance of the true per-task differences, and σ² the average within-task variance of each configuration.
| Tasks | Questions, thinking off vs low: 1 run | 3 runs | 10 runs | Coding, Haiku vs Sonnet: 1 run | 3 runs | 10 runs |
|---|---|---|---|---|---|---|
| 20 | 15% | 29% | 40% | 4% | 9% | 12% |
| 36 | 29% | 46% | 64% | 14% | 19% | 24% |
| 50 | 30% | 58% | 80% | 16% | 26% | 32% |
| 100 | 55% | 86% | 97% | 32% | 50% | 61% |
| 200 | 85% | 99% | 100% | 58% | 78% | 89% |
Each cell is the share of 4,000 simulated experiments that found the gap: 9.7 points for thinking, 5.0 for Haiku against Sonnet over all runs (ω² = 0.050 and 0.049). The two comparisons need different things. For the questions, runs of the same task disagree often (average within-task variance 0.106 with thinking off), so repeats pay: Miller’s formula asks for 180 tasks with one run each, 69 with five and 55 with ten. For the coding gap, most of the variance is between tasks, so repeats help less: 356 tasks with one run, 193 with five, 173 with ten, and even unlimited repeats would leave 153. In both cases the step from 5 to 10 repeats saved only 10% to 20% of the tasks; beyond about five repeats, money is better spent on new tasks. Anthropic’s eval guide says “20-50 simple tasks drawn from real failures is a great start”, which is right for finding failures, but a 5-point difference between two capable agents needs hundreds of tasks.
Step 6: can an LLM judge replace the tests?
Many agent tasks have no hidden tests, so teams grade them with an LLM judge. The coding runs allow a check. judge.py showed claude-haiku-5-5 (adaptive thinking, effort medium) the full issue and each run’s diff, never the tests, and asked whether the patch “fully fixes the bug the report describes, for every case the report mentions, without breaking existing behaviour”, ending with VERDICT: PASS or VERDICT: FAIL. It judged all 420 coding runs for $0.33; claude-sonnet-5-5 judged 100 of them: all 56 the tests failed and 44 random passes.
| Judge | Runs judged | Passing runs called PASS | Failing runs called FAIL (95% CI) | Cost per verdict |
|---|---|---|---|---|
| Haiku 5.5 | 420 | 358 of 364 (98.4%) | 36 of 56 (64.3%, 51.2-75.5) | $0.00079 |
| Sonnet 5.5 | 100 | 43 of 44 (97.7%) | 43 of 56 (76.8%, 64.2-85.9) | $0.00836 |
The Haiku judge agreed with the tests on 93.8% of runs, a Cohen’s kappa (agreement corrected for chance) of 0.70, the bar the support-bot eval post sets before a judge is used. Its errors were almost all in one direction: it passed failing patches, so it raised every score, and by different amounts: it caught 32 of Haiku’s 42 failures but only 4 of Sonnet’s 14. Graded by the judge, Haiku scored 87.1% and Sonnet 95.7%, a gap of 8.6 points where the tests showed 5.0. A judge whose mistakes correlate with the thing being compared fails the second test in the trustworthy-judge post: its “biases must not correlate with the change you are evaluating.”
The stronger judge caught more, 43 failures against Haiku’s 36 on the same 100 runs, at 10.6 times the cost per verdict, and still passed 7 of Sonnet’s 14. Both judges passed all 10 failing runs of the toolz.accumulate bug from Part 8, where the fix also changed initial == no_default to initial is no_default and broke a hidden test that passes an equal but not identical sentinel. The Sonnet judge saw the change and approved it: “If a user passes an equal string that is not the same object, the old code would treat it as no_default, while the new code treats it as an initial value. That is better.” A judge can only check what the bug report and the diff show; the tests encode conventions neither mentions.
Step 7: cost per solved task
A score without a cost invites the cheapest trick there is: run the agent more times. AI Agents That Matter (Kapoor et al., 2024) warns that “accuracy alone cannot identify progress because it can be improved by scientifically meaningless methods such as retrying”. Its simple baselines matched complex agent designs on HumanEval while “the cost can differ by almost two orders of magnitude”. The fair unit is cost per solved task: total spend divided by successful runs.
On the questions, thinking at effort low cost 40% more per run than thinking off ($0.00192 against $0.00137) but only 25% more per solved run ($0.00221 against $0.00177), because it failed less; it also raised pass^10 from 38.9% to 55.6%. On the coding bugs, Sonnet cost 7.3 times as much per run and 6.9 times as much per solved run, for a gap the data can’t confirm.
Retrying shows why. Three Haiku runs per bug cost $0.0078 and give a pass@3 of 92.3%, above Sonnet’s single run at 90.0% for $0.0191. But that only holds if something picks out the successful run, and the hidden tests that could are exactly what a production agent lacks. pass@k is a ceiling on what retries buy, reachable only with a verifier as good as the grader.
The whole experiment, 1,140 agent runs, cost $4.58 on the ledger: $1.18 for the questions, $0.73 for Haiku on code and $2.67 for Sonnet on code.
In the real world
- Model cards now report repeated trials. Anthropic’s system card for Claude Haiku 5.5 averages Terminal-Bench 4.0 (66 tasks) “over 10 trials per task (660 trials)” for Haiku and five for Sonnet 5.5 and Opus 5.5, with standard errors of ±1.9 to ±2.6 points computed “with trials treated as independent”, the Wilson-style assumption Step 4 showed to be narrow. Not measured here.
- The machine matters too. Anthropic’s infrastructure noise study (February 2026) found a 6-point gap on Terminal-Bench 2.0 between the most and least generously resourced containers (p < 0.01), and concludes that “leaderboard differences below 3 percentage points deserve skepticism until the eval configuration is documented and matched”.
- The Holistic Agent Leaderboard (Kapoor et al., 2025) ran 21,730 rollouts across 9 models and 9 benchmarks for about $40,000, and found the most expensive model on the cost-accuracy frontier in only 1 of 9 benchmarks. Reading the logs, it found agents that looked up benchmark answers on HuggingFace and one that booked a flight with the wrong credit card.
Common misconceptions
- “An agent’s benchmark score is a property of the model.” It is a property of a model, a scaffold (the agent code and tools around it), a grader, a machine and a random draw. Here the same configuration scored anywhere from 75.0% to 92.9% on the same 28 tasks, and Anthropic measured 6 points from container resources alone.
- “pass^k is pass@1 to the power k.” Only if every task had the same success rate. Measured pass^10 was 71.4% where the shortcut predicts 19.7%, because failures cluster in a few tasks.
- “More repeats make any comparison significant.” Repeats shrink run-to-run noise, not the luck of which tasks you chose. Even unlimited repeats left Haiku against Sonnet needing about 153 tasks.
- “A high pass@k means the agent is reliable.” pass@k assumes something picks out the good attempt. Without a verifier, pass^k or pass@1 is the number a user feels.
- “An LLM judge is as good as the tests.” A Haiku judge with a kappa of 0.70 against the tests, the usual bar, caught 76% of Haiku’s failures and 29% of Sonnet’s, and overstated the gap between them by 3.6 points. Check agreement for each configuration you compare, not only overall.
Key takeaways
- Report pass@1 with an interval that resamples whole tasks, and say how many runs per task it rests on.
- Use pass@k when a verifier can pick a winner and pass^k when every run reaches a user, and estimate both from repeated runs with the counting formulas, not from pass@1.
- Repeats shrink run-to-run noise; only more tasks shrink the luck of which tasks you chose. Three to five repeats help, and beyond that new tasks are the better buy.
- A 5-point gap between two good agents needs a few hundred tasks. A set of 20 to 50 is for finding failures; it can’t pick a winner.
- Put cost next to every score, as cost per solved task, and check any model grader against a deterministic one before trusting it.
What’s next
A 70% pass^10 means some tasks fail some of the time, and longer tasks give each step more chances to fail. Part 12 turns to long-horizon reliability: how per-step errors compound over many dependent steps, measured, and what retries, idempotent tools, checkpoints and stopping rules do about it.
Further reading
- Evaluating Large Language Models Trained on Code (Chen et al., 2021): the unbiased pass@k estimator and why
1 - (1 - p)^kunderestimates. - τ-bench: A Benchmark for Tool-Agent-User Interaction in Real-World Domains (Yao et al., 2024): simulated users, database-state grading and pass^k.
- τ²-Bench: Evaluating Conversational Agents in a Dual-Control Environment (Barres et al., 2025): a telecom domain where the user also acts.
- GAIA: a benchmark for General AI Assistants (Mialon et al., 2023): 466 questions with one short answer each, in three levels.
- OSWorld (Xie et al., 2024) and Introducing OSWorld-Verified (XLANG Lab, 2025): desktop tasks checked by scripts, and the fixes that followed.
- SWE-Bench Pro (Deng et al., 2025): public, held-out and commercial splits designed against contamination.
- Adding Error Bars to Evals (Miller, 2024): clustered standard errors, resampling, paired differences and the sample-size formula used above.
- AI Agents That Matter (Kapoor et al., 2024): cost-controlled evaluation and simple baselines.
- Holistic Agent Leaderboard (Kapoor et al., 2025): 21,730 rollouts, cost-accuracy frontiers and what log inspection found.
- Establishing Best Practices for Building Rigorous Agentic Benchmarks (Zhu et al., 2025): the ABC checklist and the flaws it found.
- Demystifying evals for AI agents (Anthropic, 2026): tasks, trials, graders, and pass@k against pass^k.
- Quantifying infrastructure noise in agentic coding evals (Anthropic, 2026): how container resources move scores.