
Measuring LLMs: Evals and Benchmarks · Part 6 of 11
Grading Open-Ended Outputs: Metrics, Rubrics and LLM Judges
ROUGE, BERTScore, rubric graders and LLM judges, tested against expert labels: 1,600 summaries and 1,689 pairwise votes, graded by Claude Haiku 5.5.
On this page
TL;DR
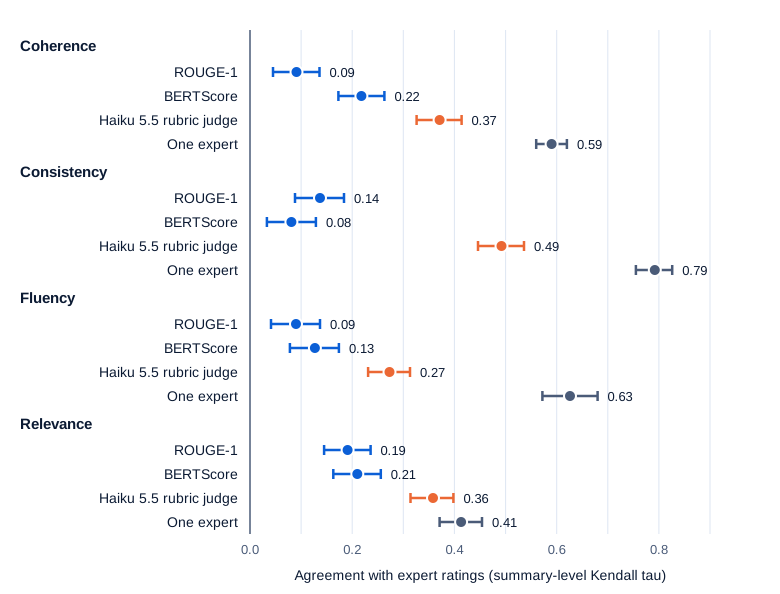
When there is no single right answer, something has to decide how good an output is. This part tests three kinds of grader against expert human labels: reference metrics (BLEU, ROUGE, chrF, BERTScore), a rubric judge that scores one output, and a pairwise judge that picks the better of two. On 1,600 news summaries rated by three experts, ROUGE-1 tracked the experts’ ranking of summaries at a Kendall tau of 0.09 to 0.19, BERTScore at 0.08 to 0.22, and a Claude Haiku 5.5 rubric judge at 0.27 to 0.49, while one expert against the other two reached 0.41 to 0.79. On 1,689 expert votes from MT-Bench, Haiku 5.5 agreed with an expert 86.0% of the time once ties are set aside, as often as the 2023 GPT-4 judge did (85.9%) and a little more than two experts agreed with each other (82.0%). Filler didn’t fool it (padding cost an answer 7.6 points of win rate), but on 64 head-to-head pairs it gave Claude-v1 15.6 points more credit than the experts did.
Why it matters
Ask “Where is the Eiffel Tower?” and grade three answers against the reference “The Eiffel Tower is in Paris.” The answer “It stands in Paris, France.” is right and gets a BLEU score of 14.5 out of 100. The answer “The Eiffel Tower is in Rome.” is wrong and gets 64.3.
Multiple-choice benchmarks, the subject of Parts 1 to 5, can be graded by comparing one letter. Summaries, chat answers, translations and agent reports can’t. Somebody has to read them, and reading is slow, so the field built stand-ins: word-overlap metrics in the 2000s, embedding metrics around 2019, and since 2023 language models grading other language models.
Each stand-in is a measuring instrument with its own error. System Design: Making LLM-as-a-Judge Trustworthy covers calibrating a judge for a product. This part measures the instruments themselves, on public data with expert labels.
The intuition
Picture three ways to mark an essay exam. The first examiner has a model answer and counts how many of its words appear in each essay. The second reads each essay alone and scores it against a marking scheme. The third reads two essays side by side and says which is better.
The word-counter is fast and never tired, but it rewards an essay that copies the model answer’s phrasing and punishes one that says the same thing in other words. The marking-scheme reader understands meaning, but has to hold a fixed scale in mind across thousands of essays. The side-by-side reader only has to make a relative call, which people find easier, but can be swayed by which essay came first.
Those are the three grader families. The analogy breaks in one place: a model examiner may share the habits of the essays it grades, because it was trained on similar text. It can end up marking its own family’s work without anyone noticing.

Swipe to pan the diagram, or tap it to zoom.
The rest of this part runs that last check for each family, on 1,600 rated summaries and 1,689 expert votes.
Step 1: reference metrics
A reference metric compares the output with one or more human-written reference answers. Each asks, in its own way, how much of the reference is in the output.
- Exact match (EM) checks whether the output equals the reference after lowercasing and removing punctuation and articles. It is the usual score for short-answer question answering.
- Token F1 counts the words the two share. Precision is the share of the output’s words found in the reference, recall the share of the reference’s words found in the output, and F1 their harmonic mean.
- BLEU (Papineni et al., 2002), built for machine translation, averages the shares of the output’s 1- to 4-word sequences (n-grams) found in a reference, with a penalty for outputs that are too short.
- ROUGE (Lin, 2004), built for summarization, leans the other way, toward recall. ROUGE-N is “an n-gram recall between a candidate summary and a set of reference summaries”; ROUGE-L uses the longest common subsequence of words.
- chrF (Popović, 2015) does the same on character n-grams, so “France” and “French” share credit.
- BERTScore (Zhang et al., 2019) replaces exact matches with meaning. It runs both texts through a pretrained encoder, takes each token’s embedding (the vector the network computes for it in context; see Embeddings and logits), matches every token to its most similar token on the other side, and averages the similarities.
Here are five of them on the opening example, using this part’s lab module (grading.py, which wraps sacrebleu 2.6.0 for BLEU and chrF and Google’s rouge-score 0.1.2):
import grading as G   # evals/lab/grading.py

ref = "The Eiffel Tower is in Paris."
for out in ["The Eiffel Tower is in Paris.",
            "It stands in Paris, France.",
            "The Eiffel Tower is in Rome."]:
    print(f"{out:32s} EM={G.exact_match(out, ref):.0f}  F1={G.token_f1(out, ref):.2f}  "
          f"ROUGE-L={G.rouge(out, ref)['rougeL']:.2f}  BLEU={G.bleu(out, ref):5.1f}  chrF={G.chrf(out, ref):5.1f}")
The Eiffel Tower is in Paris. EM=1 F1=1.00 ROUGE-L=1.00 BLEU=100.0 chrF=100.0
It stands in Paris, France. EM=0 F1=0.40 ROUGE-L=0.36 BLEU= 14.5 chrF= 27.4
The Eiffel Tower is in Rome. EM=0 F1=0.80 ROUGE-L=0.83 BLEU= 64.3 chrF= 73.3Every overlap metric ranks the wrong answer above the right one. Changing “Paris” to “Rome” alters one word in six, and the metric has no idea that this one word is the answer. BERTScore (roberta-large, layer 17, our implementation) keeps the same order: 1.000 for the copy, 0.909 for the correct paraphrase and 0.987 for Rome.
Reference metrics work when outputs are short and the answer space is narrow, like EM for a date or a name, or BLEU averaged over thousands of translated sentences. They break down when many different outputs are equally good, because one reference covers only one of them.
Step 2: metrics against experts, measured on SummEval
To measure how far that breakdown goes, you need outputs that humans have rated. SummEval (Fabbri et al., 2021, MIT license) has 100 CNN/DailyMail news articles, each summarized by 16 different summarization systems, so 1,600 summaries. Three expert annotators who had written papers on summarization rated every summary from 1 to 5 on four dimensions:
| Dimension | What the experts judged | Share of summaries all three gave 5 |
|---|---|---|
| Coherence | Organized, builds from sentence to sentence | 6.9% |
| Consistency | Every fact supported by the article | 81.6% |
| Fluency | Each sentence well formed | 71.9% |
| Relevance | Keeps the important points, drops the minor ones | 5.2% |
Each article also comes with 11 reference summaries: the original news highlight and 10 more written for an earlier study (Kryściński et al., 2020).
Agreement is measured as a rank correlation. Kendall’s tau checks every pair of summaries and asks whether the grader and the humans put them in the same order: tau is (concordant pairs − discordant pairs) / all pairs, so +1 is the same ranking, 0 is unrelated and −1 is reversed (we use tau-b, which adjusts for tied scores). Summary-level tau ranks the 16 summaries of each article and averages over articles: can the grader tell a better summary of the same article from a worse one? System-level tau ranks the 16 systems by their mean scores: can the grader rank summarizers?
The reference point is a human: each expert scored against the mean of the other two. Every grader is scored against the same two-expert mean, so they compete on equal terms. The 95% confidence intervals come from a bootstrap that resamples the 100 articles 2,000 times (Part 3 explains the method).
Swipe to pan the diagram, or tap it to zoom.
At the summary level, no reference metric reached 0.27 on any dimension: ROUGE-1 scored 0.09 to 0.19, BLEU 0.03 to 0.11, chrF 0.08 to 0.20 and BERTScore 0.08 to 0.22, against 0.41 to 0.79 for one expert. The metrics see a little of relevance, which is about content, and almost nothing of consistency. BERTScore’s 0.08 there means it can barely tell a summary that invents a fact from one that doesn’t; to an embedding, a wrong name looks much like the right one.
Using all 11 references helped a little: BERTScore on coherence rose from 0.22 to 0.26, ROUGE-1 from 0.09 to 0.14. More references cover more of the valid ways to say something, but not many more.
System-level correlations are higher and much less certain. With 16 systems, ROUGE-1’s tau on relevance was 0.46 (95% CI 0.18 to 0.62), and BERTScore’s on consistency 0.02 (−0.23 to 0.28). Averaging over 100 articles cancels per-summary noise, which is why ROUGE survived for years as a way to compare systems, but it can’t recover a quality the metric never sees, such as consistency.
Two caveats. In SummEval’s second annotation round, experts re-checking large disagreements were “allowed to see scores assigned by other expert annotators”, so the expert ceiling is optimistic. And the original references “often contained extraneous information, such as hyperlinks and click-bait descriptions”, which hurts any metric that treats them as the target.
Step 3: a rubric judge
A rubric judge is a language model that reads the source, the output and a scoring guide, and returns a number. We gave Claude Haiku 5.5 (claude-haiku-5-5, thinking off via {"type": "disabled"}, effort left at its default) each article and summary with a rubric adapted from SummEval’s dimension definitions: one definition per dimension with anchors for scores 1, 3 and 5. The reply was forced into JSON with four integers using structured outputs, so all 1,600 replies parsed. The run cost $0.13 through the Message Batches API, about 1,500 input and 33 output tokens per summary.
The judge beat every reference metric on every dimension, by 0.11 to 0.44 in tau, and every paired bootstrap interval for those gaps lies above zero. Its summary-level tau was 0.37 (0.33 to 0.41) on coherence, 0.49 (0.45 to 0.54) on consistency, 0.27 (0.23 to 0.31) on fluency and 0.36 (0.31 to 0.40) on relevance. On relevance it sits close to a single expert (0.41, CI 0.37 to 0.45). On consistency and fluency it is still far below. System-level, it ranked the 16 systems at tau 0.67 to 0.78 on three dimensions, near the experts’ 0.77 to 0.88, but only 0.40 on fluency.
Three findings about the rubric itself:
- The anchors didn’t help. A second run that gave Haiku only the four dimension names, with no definitions or anchors, matched the anchored rubric on coherence, consistency and relevance (differences of −0.01 to +0.02, every interval crossing zero) and beat it on fluency by 0.08 (0.03 to 0.12).
- One anchor hurt. SummEval’s summaries are lowercased and split into tokens (“he did n’t know”), a leftover of how the systems’ outputs were preprocessed. The experts gave 71.9% of them a perfect 5 for fluency. Our fluency anchor said “no missing capitals”, and Haiku took it literally: 57% of its fluency scores were 1 or 2. On 200 summaries, deleting those three words raised the mean fluency score by 0.32 (0.24 to 0.40), and restoring sentence capitals and spacing in the summaries raised it by 0.12 (0.02 to 0.22). A rubric written without looking at the data encoded a standard the human raters never applied.
- The judge is consistent with itself. A second identical run gave the same score 85% to 91% of the time, a kappa of 0.74 to 0.84 per dimension. Cohen’s kappa is agreement corrected for chance: 0 means no better than chance, 1 means perfect. Averaging the two runs didn’t improve agreement with the experts, so the judge’s distance from humans is systematic. More samples from the same judge tighten the error bar around the same biased number.
Step 4: pairwise judges and human agreement
A pairwise judge sees one question and two answers and says which is better, or that they tie. Zheng et al. (2023) built MT-Bench, 80 open-ended questions in 8 categories, and collected 3,355 expert votes (the annotators, per the dataset card, are “mostly graduate students with expertise in the topic areas of each of the questions”) comparing answers from six 2023 models: GPT-4, GPT-3.5, Claude-v1, Vicuna-13B, Alpaca-13B and LLaMA-13B. The votes are public as lmsys/mt_bench_human_judgments (CC-BY-4.0). We used the first-turn votes: 1,689 votes on 910 answer pairs, 484 of them judged by at least two different experts.
Haiku 5.5 judged every pair with MT-Bench’s own judge prompt (pair-v2, from FastChat, Apache-2.0), which asks for a short explanation and then [[A]], [[B]] or [[C]] for a tie. Every pair was judged twice, once in each order, and a win counted only if it survived the swap; otherwise the pair became a tie, the paper’s convention. Of the 1,820 replies, 41 (2.3%) ran past the 600-token limit before giving a verdict; we re-asked those with a 2,000-token limit, and all 1,820 then parsed. The run cost $0.25.
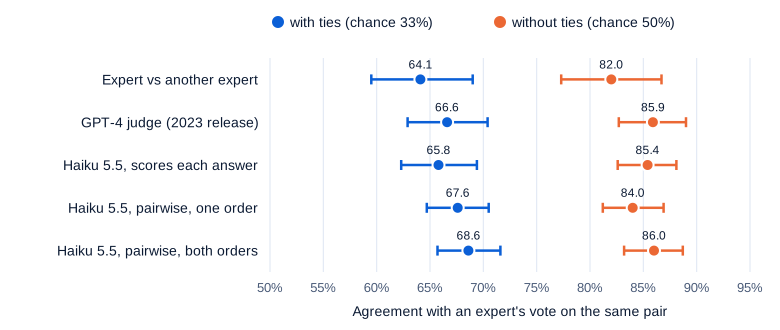
Agreement follows the paper: the chance that the judge and a randomly chosen expert agree on a randomly chosen pair. “With ties” counts tie as a verdict (chance agreement 33%); “without ties” drops any comparison where either side said tie (chance 50%). Expert-expert agreement uses every two different experts who voted on the same pair. Intervals resample the 80 questions, because votes on one question are correlated.
Swipe to pan the diagram, or tap it to zoom.
Recomputed from the released data, the 2023 GPT-4 judge agreed with experts 66.6% with ties and 85.9% without, matching the paper’s 66% and 85%. Two experts agreed 64.1% and 82.0% (the paper: 63% and 81%). Haiku 5.5 agreed 68.6% (65.7 to 71.6) and 86.0% (83.2 to 88.7), a kappa of 0.51 (0.46 to 0.56) against the experts’ 0.45 with each other. Every interval overlaps, so on this data the 2026 Haiku judge, the 2023 GPT-4 judge and a second expert can’t be told apart.
Some variations, each against the same expert votes:
| Judge setup | With ties | Without ties | Notes |
|---|---|---|---|
| Haiku 5.5, pairwise, both orders | 68.6% | 86.0% | the main run, 910 pairs |
| Haiku 5.5, pairwise, one order only | 67.6% | 84.0% | 89.2% of verdicts survived the swap |
| Haiku 5.5, rates each answer 1-10 | 65.8% | 85.4% | 23.6% of pairs tied on score |
| Haiku 5.5, pairwise, with reference answer | 72.5% | 91.7% | 334 math, reasoning, coding pairs |
| Haiku 5.5, same 334 pairs, no reference | 70.4% | 90.8% | difference +2.1 (−1.5 to +5.8) |
| Sonnet 5.5, pairwise, both orders | 69.4% | 88.4% | 80 pairs; Haiku on the same: 69.4%, 84.0% |
Pairwise beat pointwise only where ties count: judging the two answers together agreed with experts 2.8 points (0.5 to 5.1) more often than rating each alone, whose scores tied on 23.6% of pairs. Pointwise grading still scales better, since each output is graded once instead of once per pair and order.
Reference-guided judging, where the judge also sees a correct answer, was MT-Bench’s fix for math: GPT-4 wrongly approved incorrect answers on 14 of 20 math judgments without a reference and 3 of 20 with one. For Haiku 5.5 the reference added 2.1 points on math, reasoning and coding, with an interval crossing zero. A judge that can solve the problem gains little from seeing the answer.
Sonnet 5.5 (claude-sonnet-5-5, {"type": "between_tools"}, its no-thinking setting) judged a random 80 of the pairs in both orders for $0.57, about 27 times Haiku’s cost per verdict. It agreed with experts 88.4% of the time without ties (80.0 to 94.9), against Haiku’s 84.0% on the same pairs; on about 100 decisive votes the intervals overlap widely. The two Claude judges agreed with each other on 88.8% of pairs (80.0 to 94.0), a kappa of 0.82, far above either judge’s kappa with experts, so their agreement says little about whether they are right.
At the system level, ranking the six models by win rate, Haiku and the experts agreed at Kendall tau 0.87: one swap, of Claude-v1 and GPT-3.5, which the experts had in a near tie (62.5% and 62.8% average win rate).
Step 5: biases, tested
System Design: Making LLM-as-a-Judge Trustworthy lists the known judge biases and their fixes. Here are three of them, measured on Haiku 5.5.
Position bias is preferring an answer for where it appears. Haiku kept its verdict after a swap on 89.2% of pairs (87.0 to 91.1). In the 196 verdicts on the other 98 pairs it picked the first slot 88 times and the second 60 times, a mild lean toward first. For scale, MT-Bench’s 2023 test, which used two near-identical answers on purpose, found GPT-4 consistent on 65.0% and Claude-v1 on 23.8%. Judging both orders cost twice as much and added 2 points of agreement without ties.
Verbosity bias is preferring longer answers whether or not the extra length adds anything. We tested it with a controlled change: on 300 random pairs, we appended an 87-word paragraph that says nothing (“I hope this answer is helpful. To summarize, the response above addresses the question…”) to one answer.
| Duel, both orders | Longer copy won | Original won | Tie |
|---|---|---|---|
| An answer vs its own copy plus the filler (300 answers) | 0.5% | 86.5% | 13.0% |
| An answer vs itself, “To restate the main points:”, and itself again (150 answers) | 0.0% | 69.7% | 30.3% |
On the 300 real pairs, adding the filler to one side cut that side’s win share by 7.6 points (6.0 to 9.5).
Haiku 5.5 punished the padding. The judge prompt says “Do not allow the length of the responses to influence your evaluation”, and this judge obeys. In the untouched data the longer answer won 69.8% of Haiku’s decisive verdicts and 69.1% of the experts’ votes: the same taste for length. The result is narrower than it sounds, because filler and verbatim repetition are easy to spot. MT-Bench’s harder “repetitive list” attack, in which GPT-4 rephrased a list and prepended it, fooled GPT-3.5 and Claude-v1 on 91.3% of 23 answers and GPT-4 on 8.7%; we did not rerun that attack. If this judge has a length bias, it would show on length that looks like content, the case the length-controlled win rates of Part 7 are built for.
Self-preference is a judge favoring outputs like its own. Panickssery et al. (2024) found that GPT-4 and Llama 2 can tell their own text from others’ and that, after fine-tuning, the strength of this self-recognition is linearly correlated with how much the model prefers its own outputs. Haiku 5.5 never wrote any MT-Bench answer, but one of the six models was an earlier Claude. On the 64 pairs that put Claude-v1 against GPT-3.5, the experts gave Claude-v1 48.0% of the credit and Haiku gave it 63.6%, a gap of 15.6 points (5.6 to 25.0). Haiku also stretched the field in general, raising GPT-4’s win rate by 9.0 points and lowering LLaMA-13B’s by 6.1, but GPT-3.5’s moved by only −0.1, so the stretch doesn’t explain the head-to-head. A shared style between Claude generations is one possible cause, family loyalty another; on 64 pairs it is a warning sign, not proof.
In the real world
The headline numbers in this field come from the same kinds of comparison, on other data:
- G-Eval, a GPT-4 judge that writes a chain of thought and averages 20 samples per score, reports summary-level Spearman correlations with SummEval’s experts of 0.455 to 0.582 (mean 0.514), against 0.225 for BERTScore and 0.192 for ROUGE-1 (Liu et al., 2023; reported, not reproduced). Our single-sample Haiku judge’s were 0.30 to 0.52, in the same order.
- SummEval’s own system-level table, using 11 references, found chrF the strongest of the classic metrics (Kendall tau 0.40 to 0.59) and BERTScore F1 at 0.04 on consistency, in line with our 0.08 at the summary level.
- Prometheus, an open 13-billion-parameter model fine-tuned to grade with a rubric, reports a Pearson correlation of 0.897 with human evaluators on 45 rubrics across three test sets, against 0.882 for GPT-4 (Kim et al., 2023; reported, not reproduced). On a fixed rubric, a small open judge can match a frontier one and keep the data on your servers.
- Novikova et al. (2017) tested 21 metrics on three datasets of system-written restaurant and hotel descriptions: they “only weakly reflect human judgements of system outputs”, with no word-overlap metric above a Spearman correlation of 0.30.
- G-Eval’s probability-weighted scores turn the probabilities of the tokens “1” to “5” into an expected score. The Claude API returns no token probabilities, so that needs an open model, as in From Scratch Part 9.
Every judge call in this article, about 10,500 of them including the Sonnet comparison, cost $1.65 in total through the Batch API.
Common misconceptions
- “A higher BLEU or ROUGE means a better answer.” Only on average, over many outputs, for tasks where good outputs look alike. On single summaries, ROUGE-1 ranked them like the experts at tau 0.09 to 0.19, and a wrong one-word substitution outscored a correct paraphrase.
- “BERTScore understands meaning, so it catches factual errors.” It matched expert consistency ratings at tau 0.08. Embeddings capture topic and phrasing; a summary with the wrong name or number sits right next to the correct one.
- “A detailed rubric makes a judge more accurate.” On SummEval, removing every definition and anchor changed nothing on three dimensions, and one careless anchor about capital letters made fluency worse. Check each anchor against how your human raters actually score.
- “LLM judges always prefer longer answers.” Haiku 5.5 rejected filler and repetition outright, losing 7.6 points of win rate for the padded side, and preferred longer answers in the real data about as often as the experts did (69.8% against 69.1%). The risk is length that looks like content, which needs a stronger test.
- “Two judges agreeing means the verdict is right.” Sonnet 5.5 and Haiku 5.5 agreed with each other at kappa 0.82, while Haiku’s kappa with the experts was 0.51. Judges from one family can share a bias, like the 15.6-point lift for Claude-v1.
Key takeaways
- Reference metrics measure overlap with a reference, not quality. On open-ended text they barely rank individual outputs, and averaging over many outputs helps only for qualities the metric can see at all.
- An LLM judge was the best automatic grader on every SummEval dimension, but still short of a single expert on consistency and fluency. Measure your judge against at least two human raters, because the human-human agreement is the ceiling.
- Rubric wording is part of the instrument: our anchors added nothing, one hurt, and re-running the judge didn’t fix it.
- On MT-Bench, a 2026 Haiku judge, the 2023 GPT-4 judge and a second expert all agreed with experts about as often: 82 to 86% once ties are set aside. Judge both orders, report ties, and keep the error bars.
- Test biases with controlled edits on your own data. Filler didn’t fool this judge, but a head-to-head on 64 pairs showed it lifting an older Claude by 15.6 points: use a judge from a different family when your system shares its maker.
What’s next
A pairwise judge gives one verdict per pair. Collect such verdicts from the public at scale, on models people choose to compare, and you get Chatbot Arena. Part 7 turns pairwise votes into Elo and Bradley-Terry ratings, and measures how vote order, answer style and length move the rankings.
Further reading
- SummEval: Re-evaluating Summarization Evaluation (Fabbri et al., 2021): 1,600 summaries with expert ratings, and the classic metrics re-scored against them.
- Judging LLM-as-a-Judge with MT-Bench and Chatbot Arena (Zheng et al., 2023): the agreement definitions, the expert votes used here, and the position, verbosity and self-enhancement tests.
- G-Eval: NLG Evaluation using GPT-4 with Better Human Alignment (Liu et al., 2023): rubric judging with chain of thought and probability-weighted scores, measured on SummEval.
- Prometheus: Inducing Fine-grained Evaluation Capability in Language Models (Kim et al., 2023): an open, fine-tuned rubric judge.
- LLM Evaluators Recognize and Favor Their Own Generations (Panickssery et al., 2024): self-recognition and its link to self-preference.
- Large Language Models are not Fair Evaluators (Wang et al., 2023): position bias in pairwise judging and how to calibrate it.
- BERTScore: Evaluating Text Generation with BERT (Zhang et al., 2019): the embedding-matching metric.
- BLEU (Papineni et al., 2002), ROUGE (Lin, 2004) and chrF (Popović, 2015): the original overlap metrics.
- Why We Need New Evaluation Metrics for NLG (Novikova et al., 2017): word-overlap metrics only weakly reflect human judgments.
- FastChat llm_judge: MT-Bench’s questions, reference answers and judge prompts.