
LLMs on the GPU: Kernels and Hardware · Part 15 of 15
One Token, Kernel by Kernel: A Decode Step on a Laptop GPU
Every kernel in one Qwen2.5-1.5B decode step on a laptop RTX 4060: what it does, its time, its place on the roofline, and where the last 15% goes.
On this page
TL;DR
This part traces one decode step of Qwen2.5-1.5B, a Llama-style model, on a laptop RTX 4060 and accounts for every kernel: 452 of them, 15 per Transformer block plus a few at the end. The weight matrix-vector products take 12.8 of the GPU’s 13.4 milliseconds and stream 3.09 GB at 241 GB/s, 97% of the measured memory ceiling. Everything else, from normalization to sampling, fits in about half a millisecond. Getting there meant fixing the one kernel the earlier parts’ lessons hadn’t reached: with Hugging Face’s default attention, the same compiled step took 16.4 ms at 1,024 tokens of context and 93 ms at 32,768, and Part 10’s split-KV kernel brought those to 14.8 and 18.0 ms. By the end you’ll see each kernel on the roofline, the step’s time budget against the bandwidth floor, how it shifts with context length, batch size and 4-bit weights, and where each earlier part of the series shows up in the trace.
Why it matters
Part 9 got a compiled decode step of Qwen2.5-1.5B down to 13.8 ms, 90% of what this laptop’s memory bus allows. Give that same compiled step a 32,768-token conversation and it takes 93 ms. The model’s weights didn’t change, and the extra data, the cached keys and values of 32,768 earlier tokens, should cost under 4 ms to read. Three of the 17 kernels in each of its 28 blocks account for 79 ms of it.
A per-kernel trace is how you find that. A step time tells you that something is slow; a trace tells you which of 508 kernels, and the roofline tells you whether it could be faster. This last part of the series takes one token apart, kernel by kernel, and uses every tool the series built along the way.
The intuition
Think of an itemized bill for a month of running a household. One line, rent, is 85% of the total, and nothing you do this month changes it. Below it are a few hundred small lines: groceries, bus fares, a coffee. Most of the savings advice you’ll hear is about the coffee. The useful exercise is to check each line against what it should cost, and that’s how you find the subscription billing you six times a month.
In a decode step, rent is reading the model’s weights: every generated token reads all of them once from GPU memory. The small lines are normalization, rotary position embeddings, writing to the cache and picking the token. The forgotten subscription turns out to be attention.
The analogy breaks in one place. A household’s bills are independent, but kernels run one after another on the same GPU, so a kernel that leaves most of the chip idle also delays everything behind it.
Step 1: one block, kernel by kernel
The setup
The configuration is Part 9’s reduce-overhead setup: Qwen2.5-1.5B-Instruct in BF16 (16-bit brain floating point), batch size 1, greedy decoding, Hugging Face Transformers 5.20.2 with a static KV cache (StaticCache, which preallocates the keys and values of every earlier token at a fixed maximum length so that each step has the same shapes and memory addresses), compiled with torch.compile(mode="reduce-overhead"), which fuses small operations into Triton kernels and replays the whole step as one CUDA graph. The cache holds 1,024 tokens; the step is traced after a 960-token prefill of real text, so attention reads about 1,000 earlier tokens. The model is Llama-class: RMSNorm, rotary position embeddings (RoPE), grouped-query attention (GQA) with 12 query heads sharing 2 key-value heads, and a SwiGLU MLP.
The machine is Part 1’s: an NVIDIA GeForce RTX 4060 Laptop GPU (8 GB, 24 SMs) under WSL2, driver 592.82, PyTorch 2.11.0 with CUDA 12.8, Triton 3.6.0. Step times are the wall time of a step with torch.cuda.synchronize() around it, the median of 40 steps after 10 warm-up steps, then the median of 3 to 5 rounds. During the main runs the memory clock held 8,000 MHz, the SM clock ran between 1,695 and 2,175 MHz, and power reached 48 W under a 50 W limit.
Nsight Systems would be the usual tool for a timeline, but on this machine nsys records no GPU kernels under WSL2, as Part 4 found, so the timeline comes from torch.profiler, which records every kernel through NVIDIA’s CUPTI library, including kernels replayed from a CUDA graph. Nsight Compute (ncu) supplied the hardware counters for every kernel of one step: DRAM bytes, achieved occupancy and tensor-core activity. It locks the SM clock at its 1.32 GHz base, so its times are used only for comparison. The core of the trace:
cache = StaticCache(config=model.config, max_cache_len=1024)

@torch.no_grad()
def step():                              # one token in, one token out
    out = model(tok_buf, past_key_values=cache, cache_position=pos_buf,
                position_ids=pos_buf.view(1, 1), use_cache=True)
    return out.logits[:, -1, :].argmax(-1, keepdim=True)

fn = torch.compile(step, mode="reduce-overhead")
with profile(activities=[ProfilerActivity.CUDA]) as prof:
    for _ in range(5): o = fn()          # five identical steps, one CUDA graph replay each
    torch.cuda.synchronize()
What one block launches
Inductor’s generated code (Part 9 showed how to read it) names each kernel after the operations it fused, which makes the trace readable. One Transformer block, after the attention fix described in Step 2, launches 15 kernels:
| # | Kernel | What it does in the model | Time | DRAM read (ncu) | Achieved occupancy |
|---|---|---|---|---|---|
| 1 | Triton add_mean_mul_pow_rsqrt | Residual add + RMSNorm before attention | 1.9 µs | 0.02 MB | 31% |
| 2 | cuBLAS gemvx | Q projection, 1,536 → 1,536, with bias | 21.6 µs | 4.74 MB | 23% |
| 3 | cuBLAS gemvx | K projection, 1,536 → 256, with bias | 5.1 µs | 0.81 MB | 21% |
| 4 | Triton cos_index_copy_mul_neg_sin | RoPE on K, write K into the cache | 1.3 µs | 0.01 MB | 8% |
| 5 | cuBLAS gemvx | V projection, 1,536 → 256, with bias | 5.1 µs | 0.81 MB | 21% |
| 6 | Triton index_copy | Write V into the cache | 1.0 µs | 0.004 MB | 8% |
| 7 | Triton cos_mul_neg_sin | RoPE on Q | 1.2 µs | 0.01 MB | 8% |
| 8 | Triton partial_kernel | Attention over 8 chunks of the cache | 6.2 µs | 1.01 MB | 8% |
| 9 | Triton combine_kernel | Merge the 8 partial results | 1.5 µs | 0.05 MB | 8% |
| 10 | cuBLAS gemvx | O projection, 1,536 → 1,536 | 20.9 µs | 4.74 MB | 23% |
| 11 | Triton add_mean_mul_pow_rsqrt | Residual add + RMSNorm before the MLP | 1.9 µs | 0.02 MB | 32% |
| 12 | cuBLAS gemvx | Gate projection, 1,536 → 8,960 | 111.9 µs | 27.55 MB | 24% |
| 13 | cuBLAS gemvx | Up projection, 1,536 → 8,960 | 111.9 µs | 27.55 MB | 24% |
| 14 | Triton mul_silu | SwiGLU: silu(gate) * up | 1.1 µs | 0.04 MB | 23% |
| 15 | cuBLAS gemvx | Down projection, 8,960 → 1,536 | 114.5 µs | 27.56 MB | 23% |
Times are medians over blocks 1 to 27 from the profiler. The gemvx kernels are cuBLAS’s matrix-vector product (GEMV) with BF16 inputs and FP32 accumulation; at batch size 1 every weight matrix multiplies a single vector, as Part 1 showed. The second residual add has no kernel of its own: Inductor folded it into the next block’s first RMSNorm.

Swipe to pan the diagram, or tap it to zoom.
Seven of the fifteen kernels read weights, and they take 391 of the block’s 407 µs.
The whole step
Twenty-eight blocks give 420 kernels. Around them: one kernel that copies the step’s inputs into the CUDA graph’s fixed buffers, one fused residual add and final RMSNorm, the LM head (the output layer, a 151,936 × 1,536 matrix that Qwen shares with its embedding table, 467 MB on its own) at 1,863 µs, an argmax over the 151,936 logits at 27 µs, and 28 one-thread kernels at the end that each add 1 to a layer’s cache-length counter, which StaticCache keeps as a tensor. That’s 452 kernels per step. Eager PyTorch on the same static cache launched 1,372 and took 27.3 ms per step; Part 9 explains the difference.
Step 2: every kernel class on the roofline
Part 4’s roofline places a kernel by its arithmetic intensity (floating-point operations, FLOPs, per byte moved to or from DRAM, the GPU’s main memory) against two measured limits: 248.7 GB/s of DRAM bandwidth and 25.3 BF16 TFLOPS on the tensor cores, which meet at a ridge point of about 102 FLOPs per byte. Below the ridge, a kernel’s best possible time is its bytes divided by 248.7 GB/s.
Grouping the step’s kernels by what they do, with bytes counted from the tensor shapes:
| Kernel class | Kernels | Time per step | Share | Minimum bytes | FLOPs per byte | Achieved | Share of 248.7 GB/s |
|---|---|---|---|---|---|---|---|
| Gate and up projections | 56 | 6,268 µs | 47.1% | 1,543 MB | 1.0 | 246 GB/s | 99% |
| Down projection | 28 | 3,205 µs | 24.1% | 771 MB | 1.0 | 241 GB/s | 97% |
| LM head | 1 | 1,863 µs | 14.0% | 467 MB | 1.0 | 251 GB/s | 101% |
| Q, K, V projections | 84 | 889 µs | 6.7% | 177 MB | 1.0 | 199 GB/s | 80% |
| O projection | 28 | 586 µs | 4.4% | 132 MB | 1.0 | 226 GB/s | 91% |
| Attention (split-KV) | 56 | 207 µs | 1.6% | 27.6 MB | 6.0 | 133 GB/s | 54% |
| RMSNorm + residual add | 57 | 104 µs | 0.8% | 1.1 MB | 0.4 | 10 GB/s | 4% |
| RoPE + KV-cache writes | 84 | 97 µs | 0.7% | 0.2 MB | 0.7 | 2 GB/s | 1% |
| SwiGLU | 28 | 30 µs | 0.2% | 1.5 MB | 0.8 | 50 GB/s | 20% |
| Argmax | 1 | 27 µs | 0.2% | 0.3 MB | 0.5 | 11 GB/s | 5% |
| Graph inputs, cache counters | 29 | 30 µs | 0.2% | none | none | none | none |
| Total | 452 | 13,304 µs | 100% | 3,121 MB | 235 GB/s | 94% |
The LM head’s 101% means the profiler’s clock and the 248.7 GB/s ceiling, measured with a read kernel in Part 4, disagree by a percent or two; against the rated 256 GB/s it’s 98%. Nsight Compute counted 3.125 GB read from DRAM for the whole step, 0.2% more than the 3.121 GB counted from the shapes, and 3.092 GB for the 197 GEMVs against 3.087 GB of weights.
Here is every class on the roofline, with a few points from other configurations, measured below, for comparison:
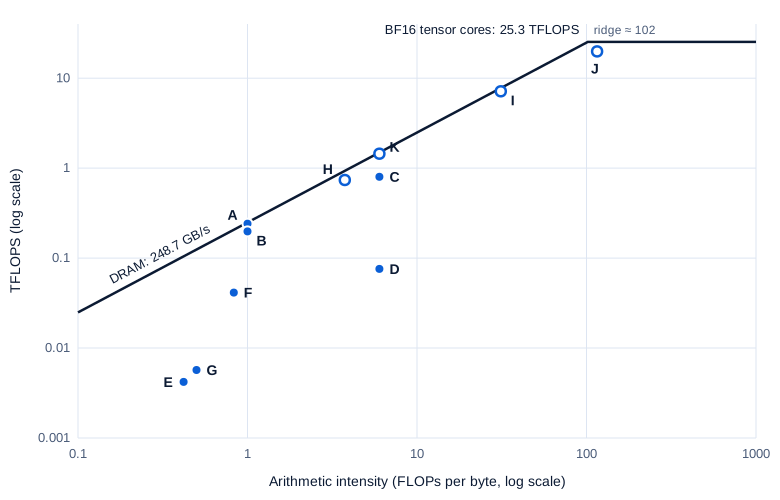
Swipe to pan the diagram, or tap it to zoom.
Most of the time sits on the roof: the weight GEMVs, 96% of the GPU’s time, run at 97% of the bandwidth line. Everything far below the line (E, F, G) is tiny, a few thousand to a few hundred thousand elements per kernel, too little work to fill 24 SMs, so these kernels are bound by latency, the regime Part 4’s flowchart sends to fusion and CUDA graphs. Both have been applied; together the 199 small kernels take 0.29 ms.
The GEMVs, through Nsight Compute
The big GEMVs reached 93% of peak DRAM throughput in ncu while only 23% to 24% of the SMs’ warp slots were occupied: 168 registers per thread and 64-thread blocks leave room for few warps. That’s Part 2’s finding that past a modest occupancy, more doesn’t help a memory-bound kernel, as long as enough loads are in flight. The tensor-core pipe was idle in every GEMV: at one token per step there are no matrices to multiply, only vectors, so Part 6’s hardware sits out. The losers are the small GEMVs. The K and V projections read 0.79 MB each in 5.1 µs, 155 GB/s; a 64-block kernel finishes before the memory system reaches full speed. All Q, K and V projections together lose 0.18 ms against the bandwidth line, the largest single loss among the weights.
The kernel that didn’t follow the series
The table above is the fixed step. Part 9’s compiled step, unchanged, runs 17 kernels per block, and four of them do attention differently:
| Kernel (one per block unless noted) | Time | What ncu saw |
|---|---|---|
Two Triton copies (repeat_kv expansion of K and V) | 2 × 6.4 µs | 1,536 blocks each; write 3.1 MB of 12-head K or V |
| Triton mask over the 1,024 cache slots | 1.0 µs | |
fmha_cutlassF_bf16_aligned_64x128 | 65.4 µs | 12 blocks of 256 threads; reads 6.3 MB; tensor pipe 25% busy; occupancy 17% |
The cause is in Transformers’ SDPA integration. A static cache needs a mask, because most slots are still empty, and the integration’s comment notes that CUDA requires “no mask and supported head dims to avoid falling back to the math kernel” before it passes grouped-query attention to PyTorch. With a mask, it copies each of the 2 key-value heads 6 times instead, so every block writes, then reads, six times the cache. PyTorch’s SDPA docs confirm that grouped-query support “currently works only for Flash_attention and math kernel on CUDA tensor”, and FlashAttention takes no arbitrary mask, so the dispatcher picks the memory-efficient kernel, which came from xFormers. That kernel tiles 64 queries at a time; at decode there is one, and its grid has one block per query head, 12 blocks for 24 SMs. It’s Part 10’s “one program per head” decode kernel, which Part 10 measured at a quarter of the memory ceiling, reading six times the bytes. On the chart it’s point D: 2.18 ms per step for 27.6 MB of useful cache, 13 GB/s.
The fix: Part 10’s split-KV kernel
Part 10’s Flash-Decoding kernel needs two changes to run inside this step. It has to read Hugging Face’s cache layout, (batch, head, slot, dimension), and inside a CUDA graph the number of valid tokens can’t be a Python integer, because the graph would bake in the value it saw at capture. So the kernel reads it from the GPU at run time and lets chunks past the end exit early:
    seq_len = tl.load(POS) + 1                   # valid tokens, read on the GPU at run time
    lo = split * SPLIT
    hi = tl.minimum(lo + SPLIT, seq_len)         # chunks past the end skip the loop
    for start in range(lo, hi, BLOCK_N):
        ...                                      # Part 10's online-softmax loop, unchanged
    l_safe = tl.where(l_i > 0, l_i, 1.0)         # an empty chunk stores 0 with weight 0
It’s registered with transformers.AttentionInterface.register("sdpa", attn), where attn calls the split-KV kernel for single-token queries and the original SDPA for prefill. torch.compile accepts user-written Triton kernels inside the compiled step; the only surprise was that Inductor passed the Python float 1/√d as FP64, which broke Triton’s type check until it became a compile-time constant. Each of the 2 key-value heads gets 8 chunks of 128 slots, 16 programs per layer, and reads each cached key and value once for all 6 of its query heads. On random inputs at four cache lengths, the kernel’s output stayed within 1.8 × 10⁻³ of an FP64 reference, and the step produced the same 20 greedy tokens as before. Attention fell from 2.18 to 0.21 ms per step, and the step from 16.4 to 14.8 ms.
Step 3: where the 14.8 ms go
The floor for a step is the bytes it must read divided by bandwidth: 3.087 GB of weights plus 27.6 MB of cache, 12.52 ms at 248.7 GB/s. The measured step, item by item:
| Item | Time | Share of the step |
|---|---|---|
| Reading the weights at 248.7 GB/s (floor) | 12.41 ms | 83.9% |
| Reading the KV cache at 248.7 GB/s (floor) | 0.11 ms | 0.7% |
| GEMVs below full bandwidth (Q, K, V 0.18, down 0.10, O 0.05, gate and up 0.07) | 0.39 ms | 2.6% |
| Attention below full bandwidth | 0.10 ms | 0.6% |
| 199 small kernels (norms, RoPE and cache writes, SwiGLU, argmax, counters) | 0.29 ms | 1.9% |
| Gaps between kernels inside the CUDA graph | 0.11 ms | 0.7% |
| CPU side: graph replay call, input copy, synchronize | 1.39 ms | 9.4% |
| Measured step | 14.80 ms | 100% |
On the GPU the step spans 13.41 ms, 93% of the floor. Wall time adds the CPU’s part: launching the replay through torch.compile’s CUDA graph wrapper, copying the new token into its buffer and waiting for the result. That cost varied with the laptop’s CPU load, 0.76 ms in an identical earlier run and 1.39 ms here, and it’s the largest item after the weights. A serving loop that doesn’t wait on every token can hide part of it behind the GPU’s work. The 452 kernels themselves leave only 0.11 ms of gaps, about 0.24 µs per boundary.
Longer contexts
Attention’s share grows with the cache. With both attention paths, at four cache sizes (the steps beyond 1,024 decode with the cache nearly full):
| Context | Hugging Face SDPA path | Split-KV path | Split-KV attention | Floor (weights + cache) | Split-KV against the floor |
|---|---|---|---|---|---|
| 512 | 15.75 ms | 14.38 ms | 0.13 ms | 12.46 ms | 87% |
| 1,024 | 16.43 ms | 14.80 ms | 0.21 ms | 12.52 ms | 85% |
| 8,192 | 33.01 ms | 15.22 ms | 1.06 ms, 220 GB/s | 13.35 ms | 88% |
| 32,768 | 93.33 ms | 18.02 ms | 3.89 ms, 241 GB/s | 16.18 ms | 90% |
At 32,768 tokens the cache is 0.94 GB, 28 KB per token, almost a third of the weights. The split kernel read it at 97% of the ceiling, the 3.9 ms Part 10 predicted. The default path spent 25.9 ms copying the cache to 12 heads and 53.1 ms in the memory-efficient kernel: 85% of a 93 ms step on 0.94 GB of data. Inference Part 11 covers what models do to shrink that cache; this table shows that the kernel matters just as much.
Batching: when does decode stop being memory-bound?
Batching more sequences into one step reuses each weight byte for every sequence, so the arithmetic intensity of the weight products rises from 1 to about the batch size. Part 4 put the ridge at 102 FLOPs per byte. Split-KV attention, 1,024-token cache, each sequence with its own cache:
| Batch | Step | Tokens/s | Matrix products | Their TFLOPS | Attention |
|---|---|---|---|---|---|
| 1 | 14.2 ms | 70 | 12.9 ms | 0.24 | 0.2 ms |
| 8 | 16.1 ms | 496 | 13.2 ms | 1.9 | 1.1 ms |
| 32 | 20.1 ms | 1,596 | 13.8 ms | 7.1 | 4.0 ms |
| 64 | 24.5 ms | 2,616 | 14.3 ms | 13.8 | 8.1 ms |
| 128 | 38.6 ms | 3,319 | 19.9 ms | 19.8 | 16.2 ms |
Up to batch 64 the weight products cost almost the same as at batch 1: 64 tokens for 1.1 times the price of one. At batch 128 they reach 19.8 TFLOPS, 78% of the compute roof, at an intensity of about 116, just past the ridge (point J on the chart). Decode stopped being bound by the weights there. It didn’t stop being bound by memory: attention keeps 6 FLOPs per byte at any batch size, because every sequence reads its own cache, and at batch 128 it took 16.2 ms, 42% of the step. Without the split-KV fix, batch 32 took 69.9 ms instead of 20.1, with 54 ms in attention. (The batch-128 run saw the memory clock drop to 7,000 MHz for part of the time.)
4-bit weights
Part 11’s path quantizes every linear layer, the LM head included, to 4-bit integers in groups of 128 and runs them through PyTorch’s tinygemm kernel: 0.82 GB of weights instead of 3.09. On the same trace:
| Item | BF16 | INT4 |
|---|---|---|
| Step (median of 5 rounds) | 14.80 ms | 5.31 ms |
| Floor (weights + cache at 248.7 GB/s) | 12.52 ms | 3.42 ms |
| Matrix products | 12.81 ms, 241 GB/s | 4.18 ms, 197 GB/s |
| Attention, small kernels, gaps | 0.60 ms | 0.70 ms |
| Their share of GPU time | 4.5% | 14% |
| Same, with the default attention path | 7.17 ms step, attention 34% of GPU time |
The 4-bit step ran 2.8 times faster than BF16. The weights shrank 3.76 times, but tinygemm moved them at 79% of the ceiling, and its smallest products, Q, K and V, at 49%: Part 11 found that at 4 bits even a GEMV becomes partly an instruction problem. Everything that isn’t a weight product didn’t shrink, so its share tripled. With the unfixed attention, it would have been a third of the step. The memory clock switched between 7,000 and 8,000 MHz during these runs, which moved round times between 4.82 and 5.46 ms.
Step 4: the series in one trace
Every earlier part shows up somewhere in these 452 kernels:
| Part | Idea | Where it shows up in the trace |
|---|---|---|
| 1 | Launches are asynchronous; small kernels are launch-bound | One CUDA graph replay launches all 452 kernels; the CPU’s 0.8 to 1.4 ms is the largest item after the weights |
| 2 | Grids, blocks, warps, occupancy | GEMVs at 23% occupancy still reach 93% of DRAM throughput; split-KV gives attention 16 programs where SDPA had 12 |
| 3 | DRAM, L2 and access patterns | The weights stream from DRAM once per token; the expanded K and V copies move about 570 GB/s (read plus write), possible only because they stay in the 32 MB L2 at 1,024 tokens, and spill to DRAM at 32,768 |
| 4 | The roofline, profilers, laptop clocks | The chart above; ncu counted 3.125 GB per step against 3.121 GB from the shapes |
| 5 | Tiled matrix multiplies | Absent at batch 1; at batch 128 cuBLAS’s tiled kernels reach 19.8 TFLOPS |
| 6 | Tensor cores | Idle in every GEMV; 10% busy in split-KV attention; doing the work at batch 128 |
| 7 | Triton | 199 of the 452 kernels are Inductor’s Triton; the attention fix is Triton too |
| 8 | Reductions, RMSNorm, argmax | 57 fused RMSNorms at about 1.9 µs; Inductor’s argmax is one 512-thread block taking 27 µs, where Part 8’s 24-block version took 4.2 µs |
| 9 | Fusion, torch.compile, CUDA graphs | 15 kernels per block instead of 49 eager ones; the residual add folded into the next RMSNorm; 0.24 µs between kernels |
| 10 | FlashAttention, split-KV decode | The fix: attention 10.5 times faster at 1,024 tokens, 20 times at 32,768 |
| 11 | 4-bit weights | 5.31 ms per token, and attention’s share tripled |
| 12 | Mixture-of-experts kernels | Not in this trace: Qwen2.5-1.5B is dense |
| 13 | Many GPUs | Not in this trace: one GPU, no collectives |
Part 14 maps the same budget onto other accelerators: bytes per token over bandwidth is the floor on any of them.
In the real world
PyTorch’s own gpt-fast write-up took the same route on an A100: a static KV cache plus torch.compile(mode="reduce-overhead") took Llama-7B from 25.5 to 107.0 tokens per second, which it describes as 72% of the GPU’s bandwidth, or “Model Bandwidth Utilization”. The same step here, counted the same way (3.09 GB per token over the rated 256 GB/s), reaches 81%, or 90% on the GPU span. gpt-fast then added INT8 weights (157.4 tokens per second), INT4 with “handwritten CUDA kernels in PyTorch” (202.1) and speculative decoding.
Production engines remove the small-GEMV loss at the source. vLLM’s Llama implementation builds one QKVParallelLinear for the three attention projections and one MergedColumnParallelLinear for gate and up, so a block runs 4 weight products instead of 7, and its RMSNorm takes the residual as an argument (self.input_layernorm(hidden_states, residual)), the fusion Inductor found here. Merging Q, K and V targets the 0.18 ms that the three small GEMVs lost in this trace.
The attention fix is what decode kernels in engines already do. FlashAttention’s flash_attn_with_kvcache takes a cache that “could be pre-allocated with the max sequence length” plus cache_seqlens, “the sequence lengths of the KV cache,” per its repository: a static buffer with a length read at run time, the two changes made above.
Getting past the bandwidth floor needs more tokens per weight read. Batching (Step 3, and Inference Part 4) does it across users. Speculative decoding (Inference Part 9) does it for one user: a small draft model guesses several tokens and the big model checks them in one pass. The batch table hints at the price: 8 token positions cost 1.13 times one. gpt-fast reports about 2 times more tokens per second for CodeLlama-34B with a 7B draft model, and about 1.3 times for Llama-7B with TinyLlama-1B.
Common misconceptions
- “Decode is slow because of all the small kernels.” In the fixed step, 199 small kernels take 0.29 ms of 13.4. Reading the weights takes 12.8 ms and couldn’t take less than 12.4 at this bandwidth. Fusion and CUDA graphs already removed the small-kernel problem; what’s left is rent.
- “A step at 90% of the bound has nothing left to find.” Part 9’s step was at 90% with a 512-token cache, and the same code took 93 ms at 32,768 tokens. Short-context benchmarks hide kernels that scale with context. Trace at the context length you’ll serve.
- “Low occupancy means a slow kernel.” The weight GEMVs ran at 23% achieved occupancy and 93% of peak DRAM throughput. The SDPA kernel at 17% was slow for a different reason: 12 blocks on 24 SMs and six times the bytes.
- “4-bit weights make decode four times faster.” Here 2.8 times: the weights shrank 3.76 times, the 4-bit GEMVs ran at 79% of the ceiling instead of 97%, and everything else stayed the same size, tripling its share.
- “Batching makes decode compute-bound.” It makes the weight products compute-bound, at about 100 sequences on this GPU. Attention reads each sequence’s own cache, stays at 6 FLOPs per byte and took 42% of the step at batch 128.
Key takeaways
- One decode step of Qwen2.5-1.5B is 452 kernels. Seven weight products per block, 197 in all, take 96% of the GPU’s time and stream 3.09 GB at 97% of the measured ceiling.
- The floor is bytes over bandwidth: 12.5 ms here. The GPU spent 13.4 ms; the rest was small GEMVs, attention, 199 tiny kernels and 0.11 ms of gaps, plus about 1 ms on the CPU.
- Trace at real context lengths. The default attention path copied the cache six times and ran 12 blocks on 24 SMs, costing 85% of a 93 ms step at 32,768 tokens; Part 10’s split-KV kernel cut that step to 18 ms.
- Batching reuses each weight read: 128 sequences cost 2.7 times one step and made the weight products compute-bound, but attention stays memory-bound at any batch size.
- 4-bit weights cut the step to 5.3 ms, and attention plus the small kernels grew from 4.5% to 14% of the GPU’s time. Each fix moved the bottleneck, and only a fresh trace showed where.
What’s next
That’s the end of LLMs on the GPU, and the full reading order is on the series page. To see how a serving system builds on these kernels, with batching, paged caches, speculative decoding and disaggregated serving, the Inference & Optimization series starts with How LLM Inference Works. The Math Behind LLMs derives the operations these kernels run, and the LLM System Design series puts them into production systems.
Further reading
- Roofline: An Insightful Visual Performance Model for Multicore Architectures (Williams, Waterman and Patterson, 2009): the model behind every chart in this series.
- torch.profiler (PyTorch docs): the per-kernel timeline used here, including kernels inside CUDA graphs.
- Nsight Compute Kernel Profiling Guide (NVIDIA): the DRAM, occupancy and pipe counters quoted for each kernel.
- scaled_dot_product_attention (PyTorch 2.11 docs): SDPA’s backends and which of them support grouped-query attention.
- Flash-Decoding for long-context inference (Dao, Haziza, Massa and Sizov, 2023): the split-KV method that fixed attention in this trace.
- FlashAttention repository (Dao-AILab):
flash_attn_with_kvcacheandcache_seqlens, a production version of the same fix. - Accelerating Generative AI with PyTorch II: GPT, Fast (PyTorch team): static cache, compile, INT8 and INT4 weights and speculative decoding, with bandwidth utilization at each step.
- vLLM Llama model code: merged QKV and gate-up projections and the fused residual RMSNorm in a production engine.
- Making Deep Learning Go Brrrr From First Principles (Horace He): compute, bandwidth and overhead, the three lines of every decode budget.