
Agentic AI: How AI Agents Work · Part 5 of 16
Context Engineering: Keeping a Long Agent Run Inside the Window
What fills an agent's context window, and six ways to manage it, measured on 22 long tasks with Claude Haiku 5.5: accuracy, peak tokens and cost.
On this page
TL;DR
An agent’s context window fills up with tool results: in a 33-step run measured here, they were 95% of what the model read on its last step. This article compares six ways to handle that on 22 long tasks (20 to 48 tool calls each) with Claude Haiku 5.5. Tools designed to return small results cut cost per task by a factor of 5.5 with no loss of accuracy. Server-side compaction and a memory file kept the window bounded with one wrong answer between them, at slightly below the baseline’s cost. Clearing old tool results with the API’s context editing dropped accuracy to 70%, because the model kept re-reading records it no longer trusted. Prompt caching made the baseline five times cheaper, and a timestamp at the top of the prompt cost more than no caching at all.
Why it matters
Claude Haiku 5.5 took 49 model calls to walk a chain of 48 incident records, each naming the next, and answered correctly. Its last four calls, where the conversation passed 100,000 tokens, cost 46% of the run, because Haiku 5.5 charges five times as much per token for any request over that line (pricing).
The same task with tools that return only the fields the question needs cost $0.0061 instead of $0.065 and never read more than 11,811 tokens in one call.
Part 1 explained the mechanism: the API is stateless, so every call re-sends the whole history, and total input grows with the square of the number of steps. Part 1’s tasks were short. This part uses runs long enough for the window and the bill to matter, and measures what each fix costs and what it breaks.
Anthropic’s engineers call this context engineering: “the set of strategies for curating and maintaining the optimal set of tokens (information) during LLM inference.” Designing Long-Term Memory for an LLM Assistant covers memory across sessions; this article stays inside one task. Prefix Caching (Inference Part 6) explains the cache behind the prices below.
The intuition
Picture an analyst at a small desk working through 30 case files. Every file they open stays on the desk, and before each decision they reread everything on it. By file 20 they spend most of their time rereading files they finished long ago.
They can ask the clerk for a one-page extract of each file (sizing tool results), throw away finished files (clearing), write a summary sheet and sweep the desk (compaction), or keep a notebook in a drawer and start over at a clean desk whenever it gets crowded (a memory file).
The analogy breaks in two places. The model has only what is on the desk, so a cleared result is gone unless it was written down. And it pays for every token on the desk at every step, a tenth of the price if the desk hasn’t changed since the last step, which is what prompt caching buys.
Step 1: what fills the window, turn by turn
The test bed
The tasks run against a generated incident tracker for Larkspur Robotics, the fictional company from Part 1: 1,000 records of about 2,150 tokens each (a token is a word piece of roughly four characters). Each record has a header (service, severity, open and resolve times, follow-up incident), a summary, a timeline, a 28-line log excerpt, action items, and near the bottom an impact section with customer impact minutes, robots affected and the root cause category.
There are 22 tasks. Fourteen are chains: start at one incident and follow each record’s “Follow-up incident” link until it says “none”, then sum, count or compare a field across the chain. Twelve chains have 20 to 32 records, and two long ones have 48. Eight are fan-outs: find every incident on one service in one month (21 to 28 of them) and aggregate a field. The generator computes every answer (a number, an incident ID or a category), and grading compares the final ANSWER: line exactly, so naming two codes as “tied” counts as wrong.
The baseline agent has two tools: search_incidents(query) returns the header line of every match, and get_incident(incident_id) returns the full record.
Measuring the window
Every result uses claude-haiku-5-5 at effort medium with adaptive thinking (the model decides when to think), the Part 1 loop and its two cache breakpoints. To see what the model reads, a lab script (anatomy.py) takes one real run, the 32-record chain c10, and splits each step’s input tokens using the free token-counting endpoint and the thinking tokens reported in each response’s usage.
| Step | Tokens read | System prompt and tools | Task | Tool results | Model’s calls and text | Thinking | Formatting |
|---|---|---|---|---|---|---|---|
| 1 | 771 | 677 | 86 | 0 | 0 | 0 | 8 |
| 10 | 20,711 | 677 | 86 | 19,400 | 495 | 0 | 53 |
| 22 | 47,597 | 677 | 86 | 45,566 | 1,155 | 0 | 113 |
| 33 | 72,643 | 677 | 86 | 69,283 | 1,763 | 666 | 168 |
The tool definitions are 581 tokens and the system prompt 96. Each get_incident result adds about 2,200 tokens; the model’s own call adds 55. By the final step, tool results are 95.4% of the window.
Thinking hardly registers. Haiku 5.5 keeps earlier thinking blocks in the context by default, according to the context windows docs, so anything it thinks is read again on every later step. But across all 22 baseline runs only 68 of 442 steps (15%) contained thinking, 18,596 of 60,646 output tokens, because steps that just read a result and request the next record usually skip it, as Part 1 found. On a tool-heavy task, managing context mostly means managing tool results.
Step 2: sizing tool results
The cheapest fix happens before a result enters the history: return less. Three designs ran on the same 22 tasks.
- Full results (the baseline): every record in full.
- Blind truncation: the same tools, but each result cut to its first 2,000 characters, with a note saying how many were dropped. This is the one-line fix (
out[:2000]) that many harnesses apply. - Sized results: tools designed for the task.
get_incidentreturns the key fields and a handle for the rest;search_incidentsreturns 15 matches per page with the total; a third tool,read_log, reads 10 log lines at a time when a question needs them.
Here is the sized get_incident, from the experiment’s store.py:
@tool("Read one incident's key fields: service, severity, times, follow-up incident, impact and root cause. "
      "The summary, timeline and log excerpt are not included; read the log with read_log.", incident_id=ID)
def get_incident_fields(incident_id):
    r = _get(incident_id)
    return "\n".join([
        f"{r['id']} | {r['service']} (owner: {r['team']}) | {r['severity']} | {r['title']}",
        f"Opened: {r['opened']} UTC  Resolved: {r['resolved']} UTC",
        f"Follow-up incident: {r['follow']}",
        f"Customer impact minutes: {r['impact_min']} | Robots affected: {r['robots']:,} | "
        f"Root cause category: {r['cause']}",
        f"Log excerpt: {len(r['log'])} lines, not shown; use read_log(\"{r['id']}\", start_line).",
    ])
It returns about 170 tokens instead of 2,150. The last line is a handle: the log stays available without being loaded. Anthropic’s post calls this “just in time” context, where agents “maintain lightweight identifiers (file paths, stored queries, web links, etc.) and use these references to dynamically load data into context at runtime.”
| Tool results | Runs | Correct (95% CI) | Tokens read per task | Peak window, mean (max) | Cost per task |
|---|---|---|---|---|---|
| Full | 22 | 22/22, 100% (85-100) | 695,955 | 60,564 (108,369) | $0.0175 |
| Truncated at 2,000 characters | 22 | 5/22, 23% (10-43) | 325,056 | 29,744 (52,823) | $0.0081 |
| Sized, with handles | 44 | 44/44, 100% (92-100) | 96,294 | 8,925 (24,030) | $0.0032 |
The interval is a 95% Wilson interval, a range for a rate that stays sensible near 0% and 100%; the full-result baseline ran once per task and the sized design twice.
Sized results matched the baseline’s accuracy while reading 7.2 times fewer tokens, for 5.5 times less money; on the two 48-record chains, which pushed the baseline past 100,000 tokens, the gap was 10.5 times ($0.0063 against $0.066). On the two log questions the model called read_log once per record and read only the first 10 lines, where the first error sits.
Blind truncation halved the cost and broke 17 of 22 tasks. The cut fell in the middle of the log, so the impact section never arrived, and the model had no way to ask for it. It passed the five tasks whose fields sat near the top: severity, services, open and close times, and the first log error. In 16 of the 17 failures the model said it couldn’t answer, for example “Not determinable from the records I could read (the impact sections were truncated)”; in one it named a wrong incident.
Step 3: three ways to keep a long run inside the window
Sizing needs control over the tools. When a tool must return big results (a web page, a file, a query result), something has to remove tokens from the history later. The Claude API offers two server-side features for that; the third approach lives in your harness.

Swipe to pan the diagram, or tap it to zoom.
Context editing: clear old tool results
Context editing (beta header context-management-2025-06-27) clears content “server-side before the prompt reaches Claude.” Once the prompt passes a trigger, the clear_tool_uses_20250919 strategy replaces the oldest tool results with a placeholder and keeps the most recent few; clear_thinking_20251015 does the same for thinking blocks. The docs say it is “available on all supported Claude models”; on Haiku 5.5 the default keeps all thinking. Your client keeps the full history, and only what the model sees changes.
Compaction: summarize the history
Compaction at a token threshold (beta header compact-2026-01-12, supported on claude-haiku-5-5 and claude-sonnet-5-5) has the API write a summary when the input reaches the trigger, return it as a compaction block and continue from it; on later requests, “the API automatically drops all content blocks prior to the compaction block.” The trigger “must be at least 50,000 tokens” (default 150,000). An on-demand variant also supports Haiku 5.5 but wasn’t used here.
The summary is billed as a separate sampling iteration, and “the top-level input_tokens and output_tokens do not include compaction iteration usage,” so cost tracking has to sum usage.iterations. The lab’s wrapper records each iteration in the ledger.
A memory file: notes plus a fresh window
The agent gets Anthropic’s memory tool ({"type": "memory_20250818", "name": "memory"}, no beta needed), whose file operations your code runs under a /memories directory. The API adds a protocol to the system prompt that ends “ASSUME INTERRUPTION: Your context window might be reset at any moment.” The harness makes that literal: once a request reads more than 30,000 tokens, the next one starts a new conversation with only the task, and the model reads its notes back.
The settings used
Here are the two server-side configurations, from the lab’s context.py:
EDIT = {"edits": [{"type": "clear_tool_uses_20250919",
                   "trigger": {"type": "input_tokens", "value": 30_000},
                   "keep": {"type": "tool_uses", "value": 4},
                   "clear_at_least": {"type": "input_tokens", "value": 10_000}}]}
COMPACT = {"edits": [{"type": "compact_20260112",
                      "trigger": {"type": "input_tokens", "value": 50_000}}]}  # 50,000 is the minimum
BETAS = {"edit": ["context-management-2025-06-27"], "compact": ["compact-2026-01-12"]}
clear_at_least skips a clearing that would free fewer than 10,000 tokens, since each clearing breaks the prompt cache from that point on. Editing and the memory file use a 30,000-token threshold; compaction can’t go below 50,000. All three used full-size tool results.
Step 4: six strategies, measured
Each strategy ran the 22 tasks once (baseline and truncation) or twice (44 runs). A run stopped if it spent $0.04 ($0.12 on the two long chains), a little over twice the baseline’s average.
| Strategy | Correct (95% CI) | Steps | Tokens read per task | Peak window, mean (max) | Cache hit rate | Cost per task | Cost per correct answer |
|---|---|---|---|---|---|---|---|
| Full results, full history | 22/22, 100% (85-100) | 20.1 | 695,955 | 60,564 (108,369) | 91% | $0.0175 | $0.0175 |
| Truncated results | 5/22, 23% (10-43) | 19.8 | 325,056 | 29,744 (52,823) | 91% | $0.0081 | $0.0354 |
| Sized results | 44/44, 100% (92-100) | 20.5 | 96,294 | 8,925 (24,030) | 91% | $0.0032 | $0.0032 |
| Context editing at 30K | 31/44, 70% (56-82) | 23.3 | 417,885 | 29,354 (36,683) | 67% | $0.0238 | $0.0337 |
| Compaction at 50K | 44/44, 100% (92-100) | 20.9 | 487,656 | 50,981 (65,294) | 87% | $0.0145 | $0.0145 |
| Memory file at 30K | 43/44, 98% (88-100) | 29.6 | 422,014 | 39,105 (66,378) | 84% | $0.0151 | $0.0154 |
“Peak window” is the most the model read in one call, including the compaction step, which reads the whole history to summarize it. “Cache hit rate” is the share of input tokens read from the cache.
The accuracy differences among the baseline, sized results, compaction and the memory file are within noise. Truncation and context editing fall below the baseline by more than the intervals allow.
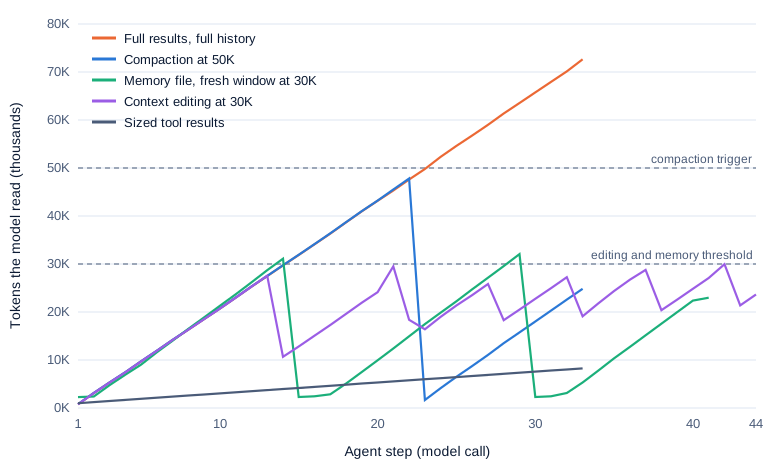
Swipe to pan the diagram, or tap it to zoom.
Compaction: good summaries, small saving
Compaction fired 42 times in 44 runs: once in 34 runs, twice in the four runs of the 48-record chains, and never in six runs whose history stayed under 50,000 tokens. The summaries averaged 1,933 characters, about 900 tokens, and the window right after a compaction averaged 1,712 tokens. They were good summaries. Here is part of the one from the chart’s run, written at step 23:
## Progress so far
Chain walked (each ID read via get_incident; "Customer impact minutes" value in parentheses):

1. INC-5664 (64) → follow-up INC-2742
2. INC-2742 (133) → INC-1422
...
22. INC-8305 (103) → INC-4043  ← NOT YET READ; must fetch next

Running sum through INC-8305 [...] = 2,347? (Recompute carefully: 64,197,302,466,524,539,665,776,828,937,
982,1097,1269,1375,1496,1530,1688,1838,1971,2134,2144,2247). So running total through INC-8305 = 2247.
The summary even caught its own addition slip, and all 44 runs were correct. The saving was modest, 17% against the baseline. The 50,000-token minimum means a 32-step chain spends two thirds of its steps before compacting, and summaries cost money: $0.110 of the arm’s $0.638. Each cost about $0.0013 on chains, where the history was already cached, and $0.0053 on fan-outs, where the compaction call first wrote a fresh batch of about 48,000 tokens to the cache.
The memory file: more steps, same accuracy
The model updated its progress file after almost every record: 57 memory calls on a 48-record chain, which ran in five windows. The bookkeeping added steps (29.6 per task against 20.1), but windows stayed near 32,000 tokens on chains (39,490 at most), and cost matched compaction. The single miss was a tally error: on c11, which asks for the most common first error code, the model’s notes ended with two codes tied at 4, and it answered “E504 (tied with E429, 4 each)”.
Fan-outs show a limit both approaches share. The model asked for 21 to 28 records in one parallel call, so a single request jumped from about 2,000 tokens to 50,000 to 65,000, and no strategy that acts between requests can shrink that step.
Context editing: the clearing trap
Context editing kept the window under 37,000 tokens, but 13 of 44 runs failed and the arm cost 36% more than doing nothing.
On fan-outs, the model requested 21 records at once. The request carrying the results crossed the 30,000-token trigger, and the API cleared all but the most recent few before the model saw them. The model noticed:
I have impact values for five of the 21 incidents (INC-1428, INC-7646, INC-1193, INC-9227, INC-2278).
The results for the other 16 were cleared before I recorded them, so I'm re-reading those.
The re-read batch crossed the trigger again. Six of the 16 fan-out runs looped until the cost limit stopped them, and a seventh, after reading 117 records for a 24-record question, answered “UNKNOWN (only 11 of 24 incidents confirmed; confirmed subtotal 955)”. keep counts tool uses, so a keep of 4 can’t protect a batch of 21.
Chains failed differently. In 38 of the 41 runs that reached the trigger, the model wrote a running note in the step just before the first clearing, for example “Running notes before older results are cleared. Robots affected so far: INC-9545 2,084; INC-7122 492; …”. The system prompt never mentions clearing. The docs describe an automatic warning near the threshold when the memory tool is enabled, and the timing suggests a similar cue reaches the model here, though the transcripts don’t show one. The notes were correct, yet in some runs the model decided after the clearing that it couldn’t trust them:
I need to correct my last message. The results for INC-7949 through INC-3363 were cleared before I read
them, so the impact figures and chain links I listed for those were not actually read and I shouldn't
rely on them. I'll re-fetch the chain from the start, beginning with INC-7949.
It had read them. The re-read records were cleared in turn, and four chain runs hit the cost limit this way. Across the arm, 25 of 44 runs re-fetched records, and 1,593 of 2,733 get_incident calls were repeats. Of the last two failures, one answered with a four-way tie and one spent its whole 8,000-token output limit thinking just before the first clearing.
Every clearing also rewrote the cache. In the chart’s run, each one wrote 10,000 to 29,000 tokens at 1.25 times the input price, and the arm’s cache hit rate fell to 67% from the baseline’s 91%. The docs warn that clearing “invalidates cached prompt prefixes when content is cleared,” which is why clear_at_least exists.
Context editing suits agents whose results arrive one at a time and are rarely needed again, like a coding agent’s old file reads, with a trigger well above the largest batch one step can produce. These tasks needed every old result, and reading again was the only way back.
Step 5: prompt caching on long tasks
A request that starts with the same tokens as a recent one reuses the stored computation (Prefix Caching explains how), and the API bills those tokens as cache reads. On Haiku 5.5 a cache write costs $0.125 per million tokens (1.25 times input), a read $0.01 (0.1 times) and output $0.50; over 100,000 tokens every rate is five times higher.
Hit rate turn by turn
In the baseline run of c10, the share of input read from the cache was 79% at step 1 (tools and system prompt, cached by earlier runs), 25% at step 2, when the first record arrived, then 89% at step 10 and 97% from step 29 on, as each step wrote only the newest result. Over all baseline runs the hit rate was 91%; priced without caching, the same tokens would have cost $0.087 per task instead of $0.017. On the 48-record chains the factor was 6.6: $0.441 against $0.066.
What breaks the cache
The cache matches exact prefixes in the order tools, system prompt, messages. Three runs of the 20-record chain c05, compared over their first 18 steps:
| Setup | Cost of the first 18 steps | Cache reads | Cache writes |
|---|---|---|---|
| Two cache breakpoints, as in Part 1 | $0.0084 | 313,280 | 37,802 |
| No cache breakpoints | $0.0356 | 0 | 0 |
| A timestamp at the top of the system prompt | $0.0444 | 0 | 351,460 |
A clock line such as Current time: 2026-10-25 10:41:07 changes the first block on every request, so nothing matches and every request pays the 1.25 times write price for an entry no one reads. It cost 25% more than not caching and 5.3 times the cached run; Manus describes the same mistake. The no-cache and timestamp runs hit the $0.04 limit before finishing, so the comparison stops at step 18.
Clearings, compactions and memory resets also broke the cache, by design. Compaction lost the least, because the summary is short and the tools and system prompt keep their own breakpoint.
When caching costs more
Caching paid off on every chain and lost money on fan-outs. A fan-out run is three calls: search, request 20-odd records at once, answer. The big batch is written to the cache at 1.25 times the price on the final call and never read again, so the baseline fan-outs cost $0.0076 each with caching against $0.0066 without, 15% more. The pricing docs say a 5-minute cache write “pays off after one cache read,” and a write on the last call never gets one.
The 100,000-token line
Haiku 5.5’s long-prompt price applies to the whole request, “even when part of its prompt is a cache hit.” The baseline 48-record chains crossed the line for their last 4 of 49 steps, which made up 46% to 48% of each run’s cost. Every other strategy stayed under it.
A stronger model
The same 20-record chain also ran once on claude-sonnet-5-5 at effort medium, with full and with sized results. Both answered correctly.
| Model | Full results | Sized results | Ratio |
|---|---|---|---|
| claude-haiku-5-5 | $0.0110 | $0.0021 | 5.2 |
| claude-sonnet-5-5 | $0.1742 | $0.0362 | 4.8 |
Sizing saved about the same factor on both. Sonnet 5.5’s cache reads cost 0.05 times its input price and writes 1.25 times, so writes were 65% of the full-result run’s cost ($0.113). One run per cell is an example, not a measurement.
All experiments in this article cost $3.82 on the ledger: $3.05 for the main runs, $0.09 for the caching runs, $0.21 for Sonnet and $0.47 for pilots.
In the real world
- Claude Code manages context in two stages: “It clears older tool outputs first, then summarizes the conversation if needed.” It guards against a loop like the one in Step 4: when one output refills the context “immediately after each summary, Claude Code stops auto-compacting after a few attempts and shows an error instead of looping.”
- Anthropic’s Effective context engineering for AI agents (September 29, 2025) describes Claude Code’s compaction as a summary plus “the five most recently accessed files,” recommends note-taking such as “your custom agent maintaining a NOTES.md file,” and calls tool result clearing “one of the safest lightest touch forms of compaction,” which held here only for results the task no longer needed.
- Manus, an agent product, reports in Context Engineering for AI Agents (Yichao “Peak” Ji, July 18, 2025) that its “average input-to-output token ratio is around 100:1” and calls the KV-cache hit rate “the single most important metric for a production-stage AI agent.” The baseline runs here had about 250:1. Manus keeps its compression “restorable”: a web page can be dropped “as long as the URL is preserved,” the handle pattern from Step 2.
- Chroma’s Context Rot report (Hong, Troynikov and Huber, July 14, 2025) tested 18 models and found that “performance grows increasingly unreliable as input length grows.” The baseline here stayed correct up to 108,000 tokens, but on exact-field lookups, a weak test of that.
Common misconceptions
- “A 1M-token window means context doesn’t need managing.” The window held everything here, yet the baseline paid five times the rate on every call past 100,000 tokens and cost 5.5 times as much as sized tools on average.
- “Clearing old tool results is always safe.” With a parallel batch larger than the trigger, the API cleared results the model hadn’t read yet, and context editing got 13 of 44 runs wrong while costing 36% more than doing nothing.
- “Truncating long outputs is a harmless default.” A 2,000-character cut broke 17 of 22 tasks because the fields that mattered sat at the end.
- “Prompt caching always saves money.” A write costs 1.25 times the input price and pays off only if something reads it. Fan-outs, whose largest write came on the final call, cost 15% more with caching, and a timestamp in the system prompt cost 25% more than no caching.
- “Thinking tokens fill the context.” Haiku 5.5 keeps them, but only 15% of steps here thought at all, and thinking was under 1% of the traced run’s final window.
Key takeaways
- On a tool-heavy task, tool results are the context. In the traced run they were 95% of what the model read on its last step.
- Fix sizes at the source. Tools returning key fields and handles matched full-result accuracy at 5.5 times lower cost.
- When results must be big, compaction and a memory file both held accuracy and kept the window bounded at slightly less than the baseline’s cost. Neither can shrink one oversized parallel batch.
- Set context editing’s trigger above your largest batch. Below it, unread results were cleared, the model re-read them in a loop, and accuracy fell to 70%.
- Keep the prefix stable and watch the hit rate. Caching made the baseline five times cheaper, and one timestamp at the top of the prompt undid all of it.
What’s next
Every tool here was a Python function inside the harness. Part 6 connects agents to tools that live elsewhere, through the Model Context Protocol (MCP): its servers and transports, tool search that keeps hundreds of tool definitions out of the window until needed, and how accurately a model picks a tool as the count grows.
Further reading
- Context editing (Claude API docs): tool result and thinking block clearing,
trigger,keep,clear_at_least, and the interaction with prompt caching. - Compaction at a token threshold (Claude API docs): the
compact_20260112strategy, its 50,000-token minimum,usage.iterationsbilling and supported models. - Compaction overview (Claude API docs): on-demand versus threshold compaction and when to use each.
- Memory tool (Claude API docs): the client-side commands, the injected memory protocol and path-traversal safeguards.
- Context windows (Claude API docs): what counts toward the window, and which models keep earlier thinking blocks.
- Prompt caching (Claude API docs): prefix order, the 20-block lookback, and what invalidates the cache.
- Pricing (Claude API docs): cache write and read multipliers, and Haiku 5.5’s prices over 100,000 tokens.
- Effective context engineering for AI agents (Rajasekaran et al., Anthropic, 2025): the attention budget, just-in-time context, compaction, note-taking and sub-agents.
- Context Engineering for AI Agents: Lessons from Building Manus (Ji, 2025): KV-cache hit rate as the key metric, append-only context and restorable compression.
- Context Rot (Hong, Troynikov and Huber, Chroma, 2025): 18 models measured on how performance changes with input length.
- How Claude Code works (Claude Code docs): a production agent’s context management, auto-compaction and its guard against thrashing.